The Problem
Can price and volume data alone tell you where a market is going? Not “sometimes feels like it.” Can you prove it, statistically, under realistic conditions?
That was the question. Not “build a trading bot.” That’s the easy part. The hard part is knowing whether your bot has an actual edge or is just overfitting to noise. Most trading systems never answer that question honestly. Synergy was built to force an answer.
The standard workflow (write a strategy, backtest it, see a nice equity curve, deploy) is fundamentally broken. Backtests lie. They lie about fees, about execution, about lookahead contamination, and about statistical significance. If you don’t build infrastructure to catch those lies, you’ll never know whether your results are real.
Architecture: Determinism as a Hard Constraint
The system is built in four strict layers with enforced one-way imports:
- Core: pure domain types, indicators, protocols. Every function is pure, every dataclass is frozen. No randomness, no time-based behavior, no hidden state. If you run the same backtest a year from now, you get the same result to the decimal.
- App: the backtest engine, decision logic, orchestration. Processes hundreds of thousands of candles in seconds with strict bar-close discipline. No peeking at data that wouldn’t exist yet in real-time.
- Infra: exchange adapters, Parquet and SQLite storage. Market data lives as Parquet files (minute-level candles with taker buy volume preserved), experiments and trades live in a 10-table SQLite database.
- Entrypoints: CLI tools and the API server. A structured experiment pipeline: run, report, evaluate, iterate.
This isn’t over-engineering. Determinism is the foundation. If you can’t reproduce a result exactly, you can’t trust it. And in trading, trusting a result you shouldn’t is how you lose money.
The Research Journey: Eight Versions of Being Wrong
Each major version solved the previous version’s biggest mistake. Eight versions means seven times realizing something fundamental was wrong.
Getting the basics right (V1 to V3)
Just building a correct backtester is harder than it sounds. Lookahead bias (accidentally using future data to make present decisions) is the most common and most dangerous mistake in quantitative research. It makes everything look profitable. The first three versions were about building a test harness that could detect its own errors: accurate fee simulation, realistic slippage modeling, and a structured experiment database to track every run.
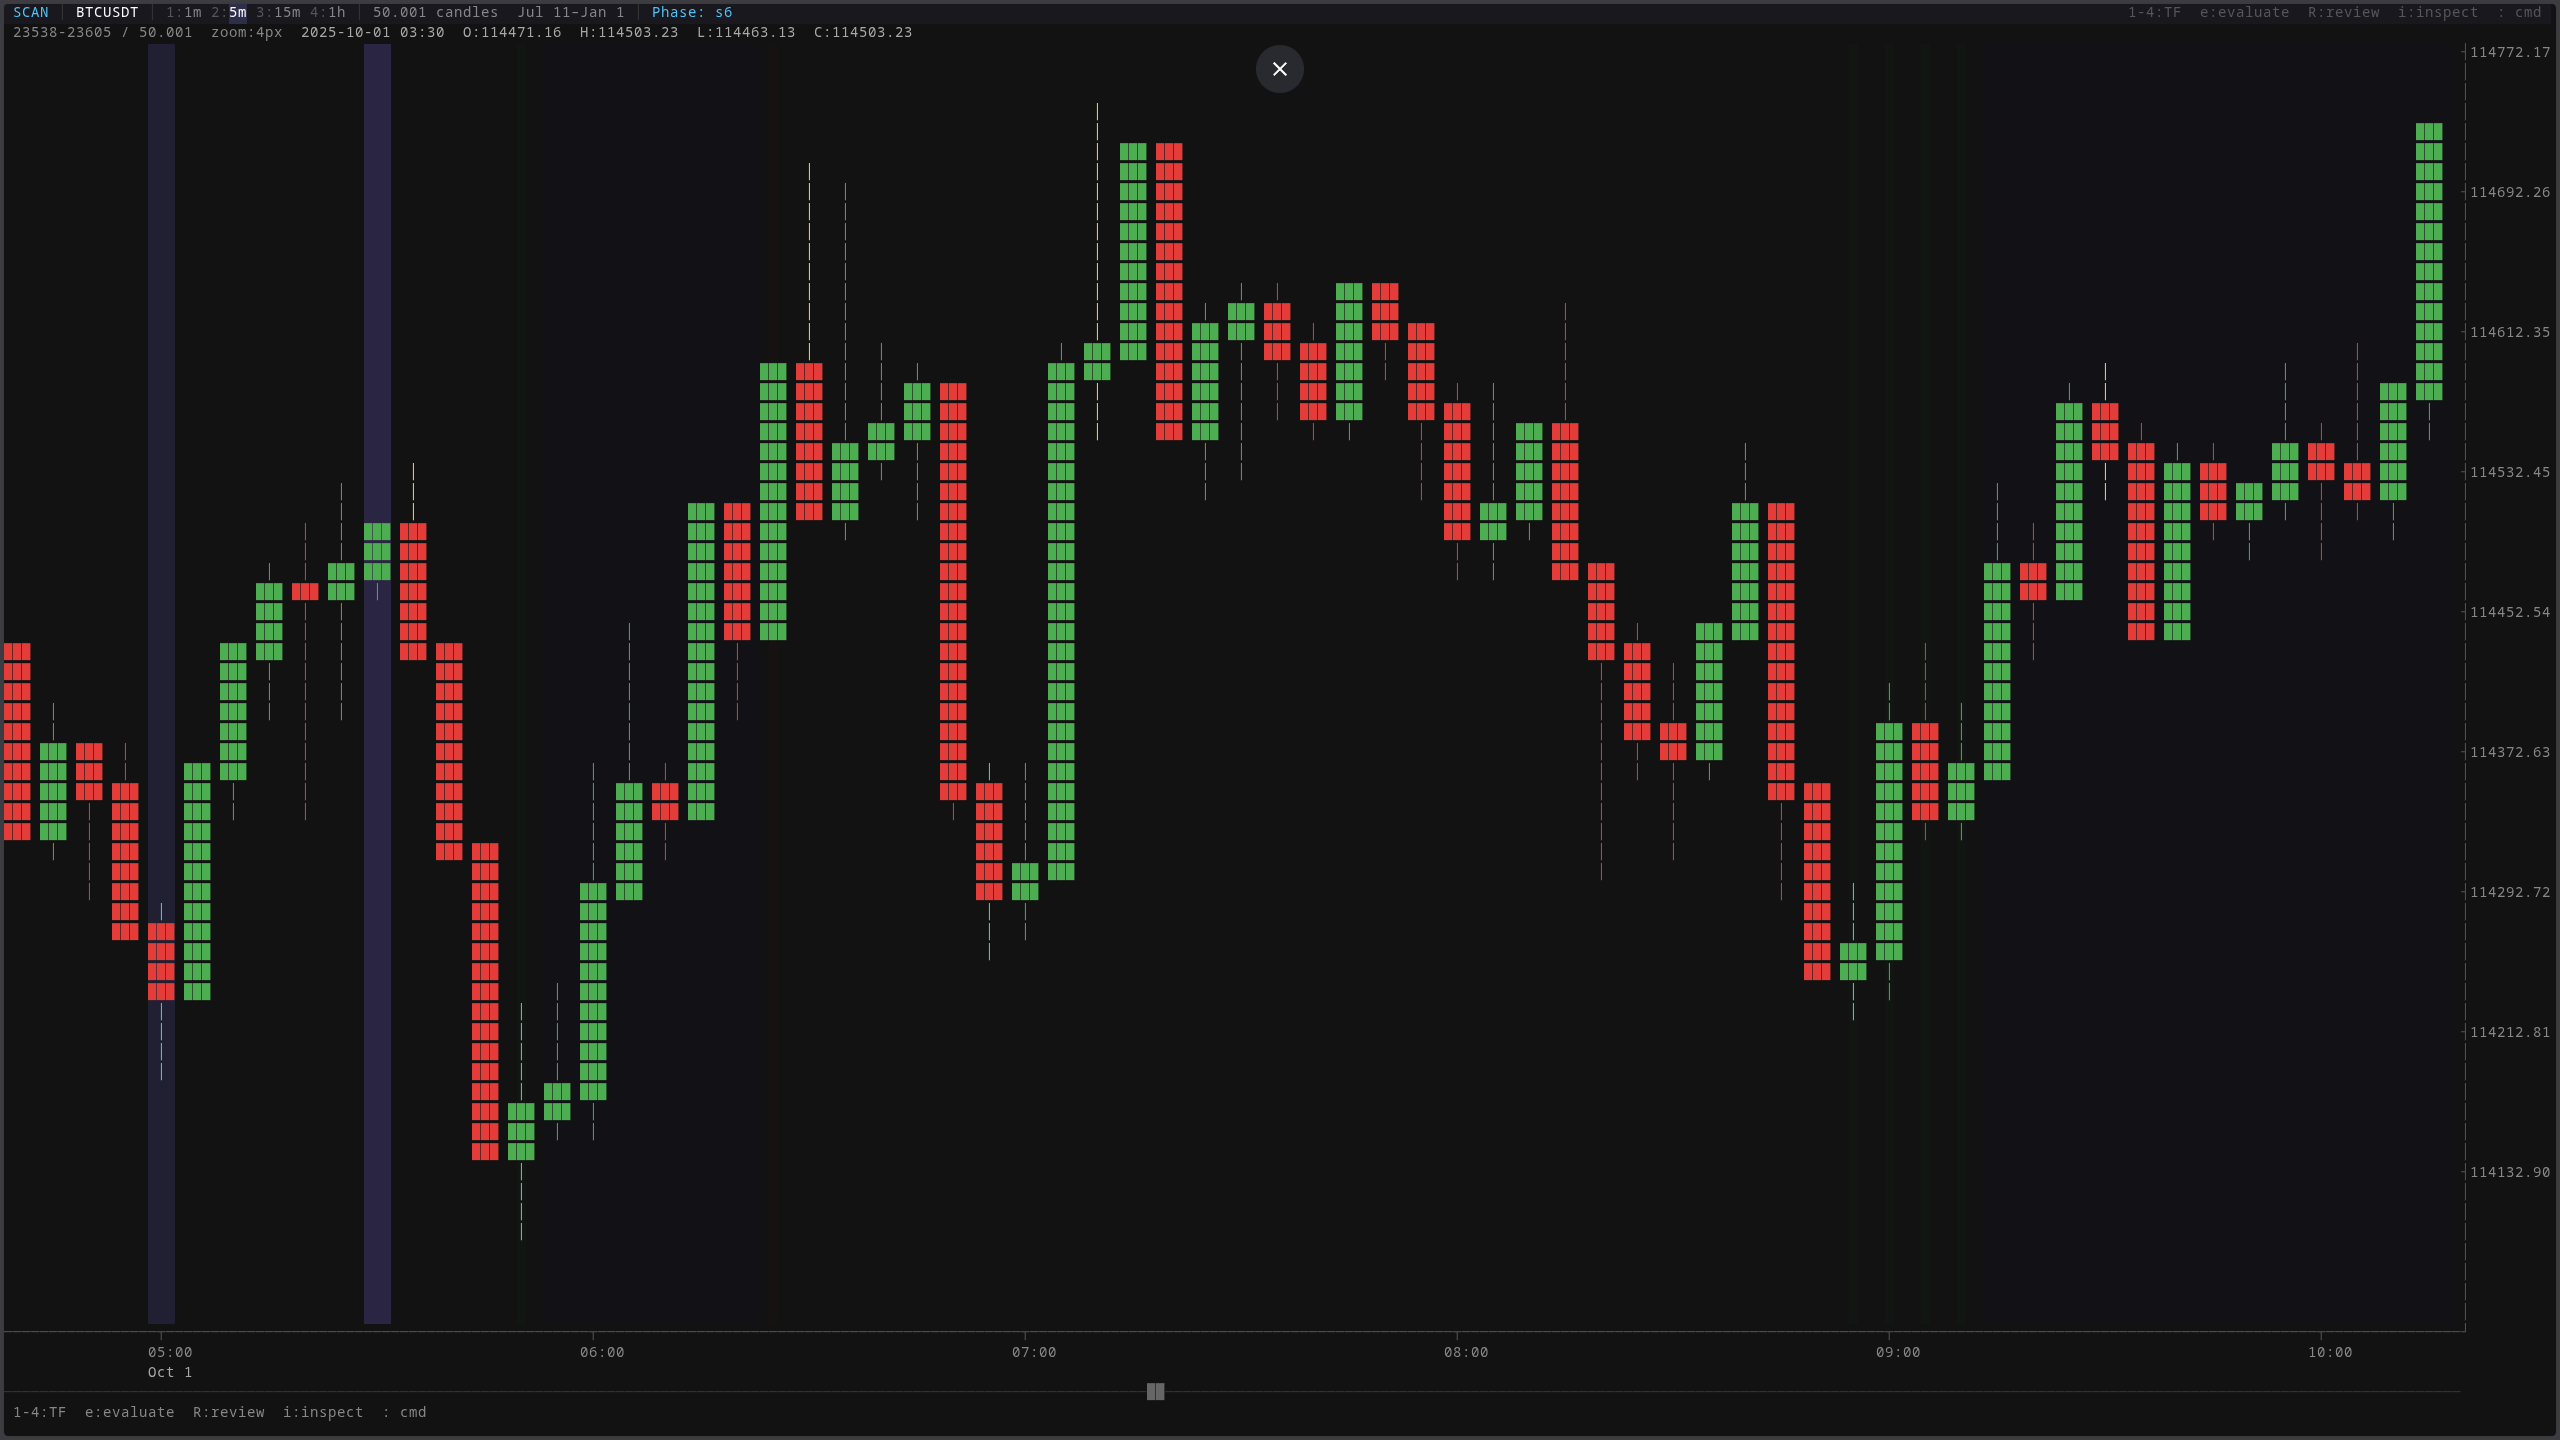
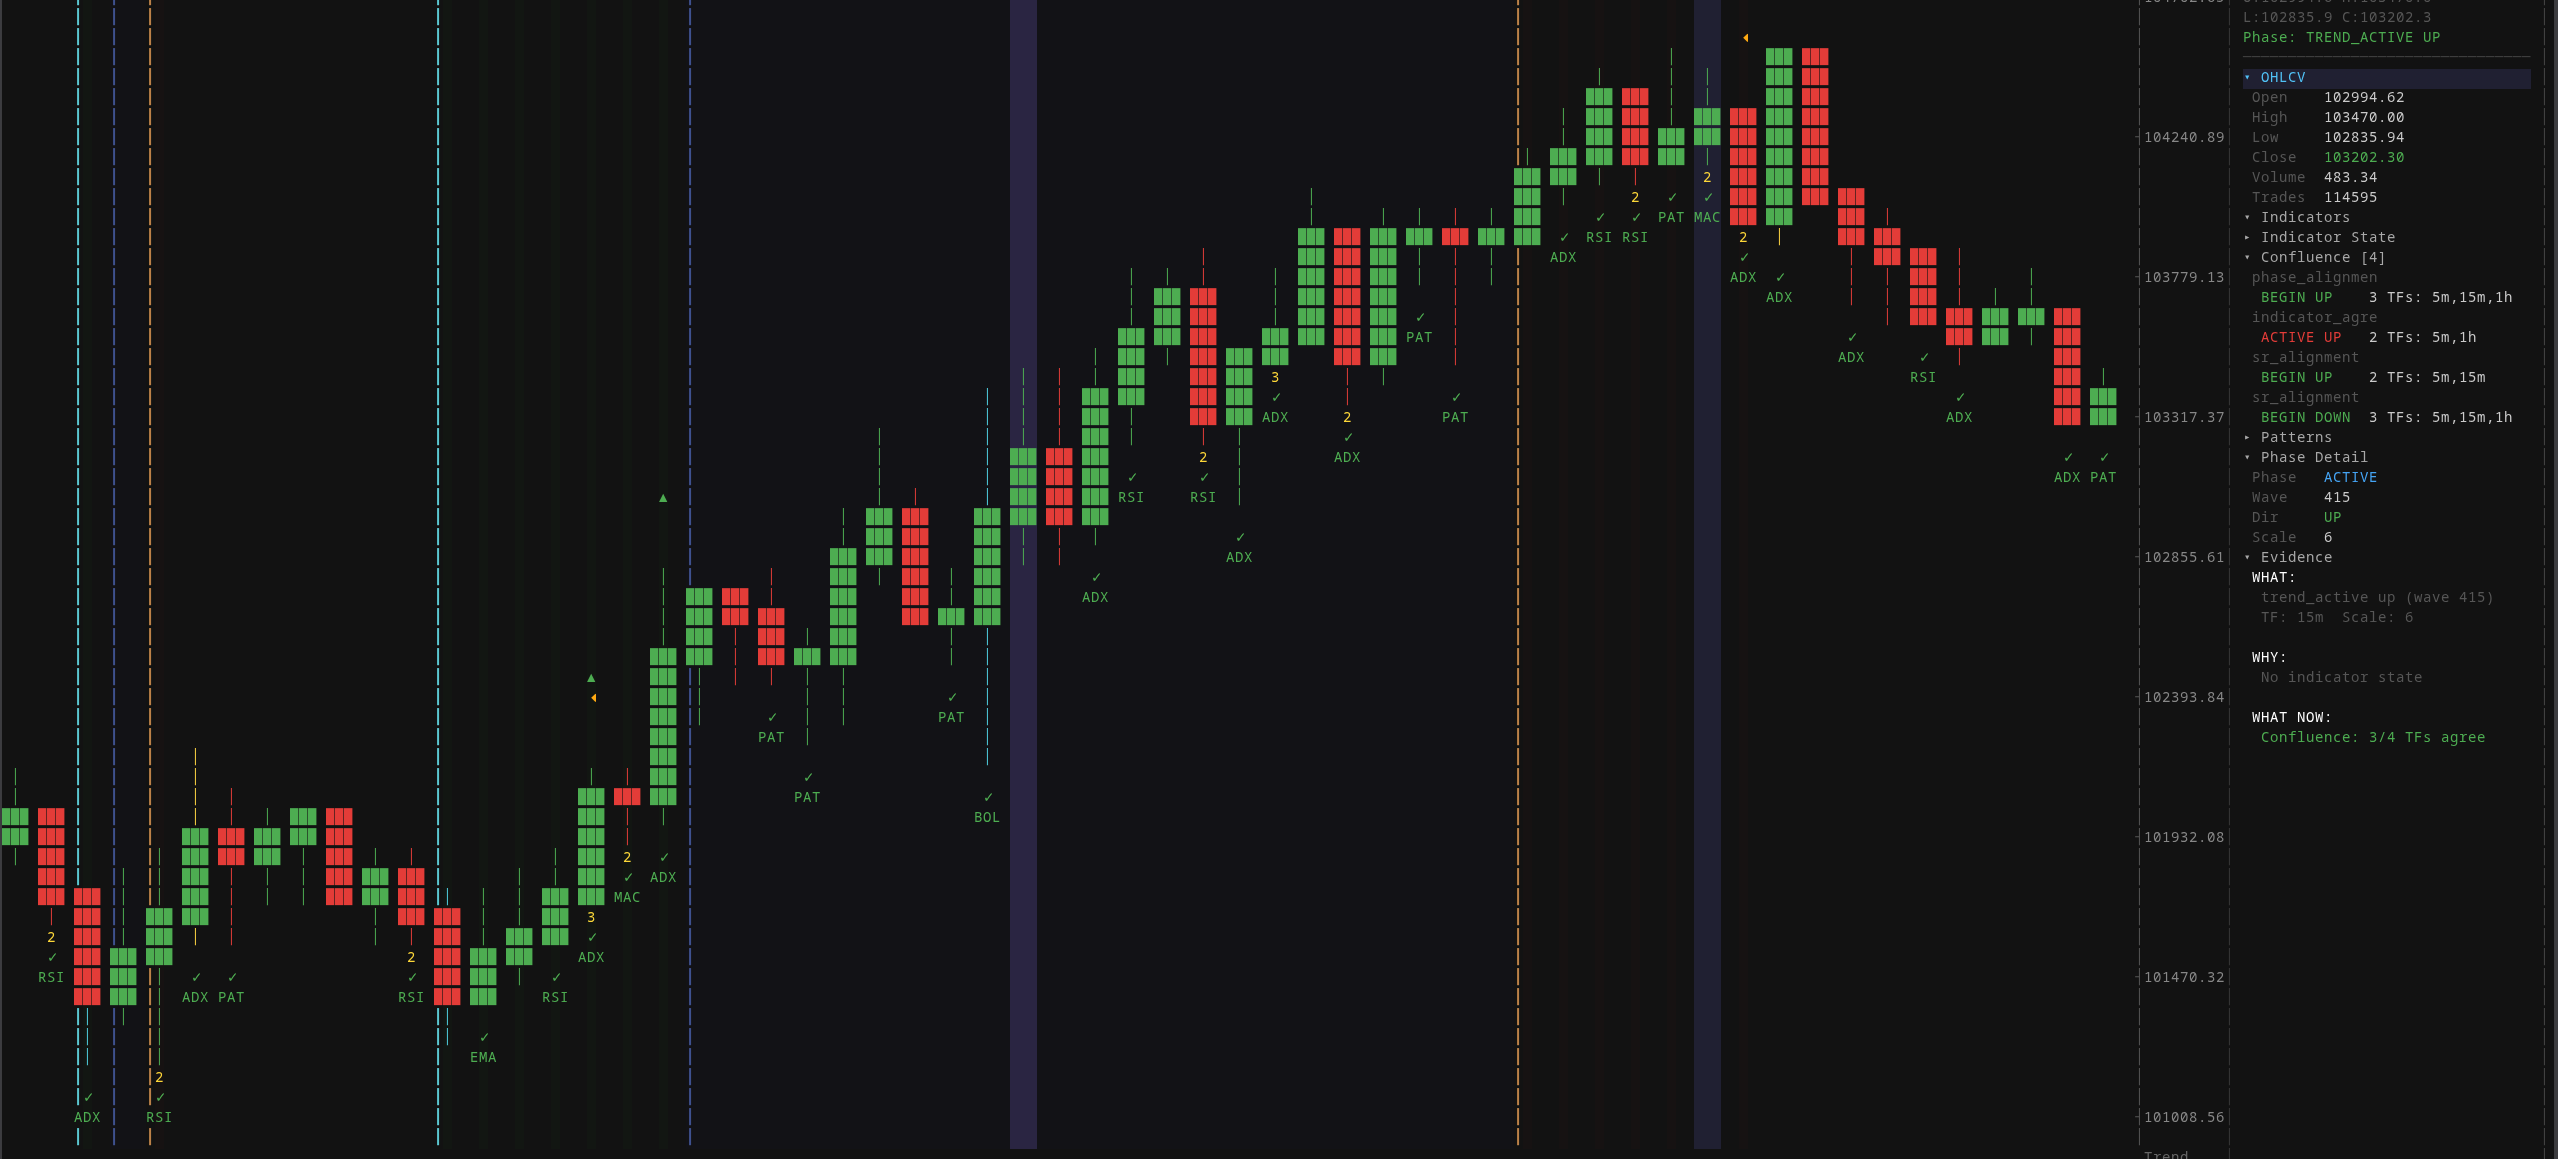
The terminal dashboard renders every candle the system processes. Each bar carries open, high, low, close, volume, and taker buy volume. Six dimensions of data that feed every signal layer downstream.
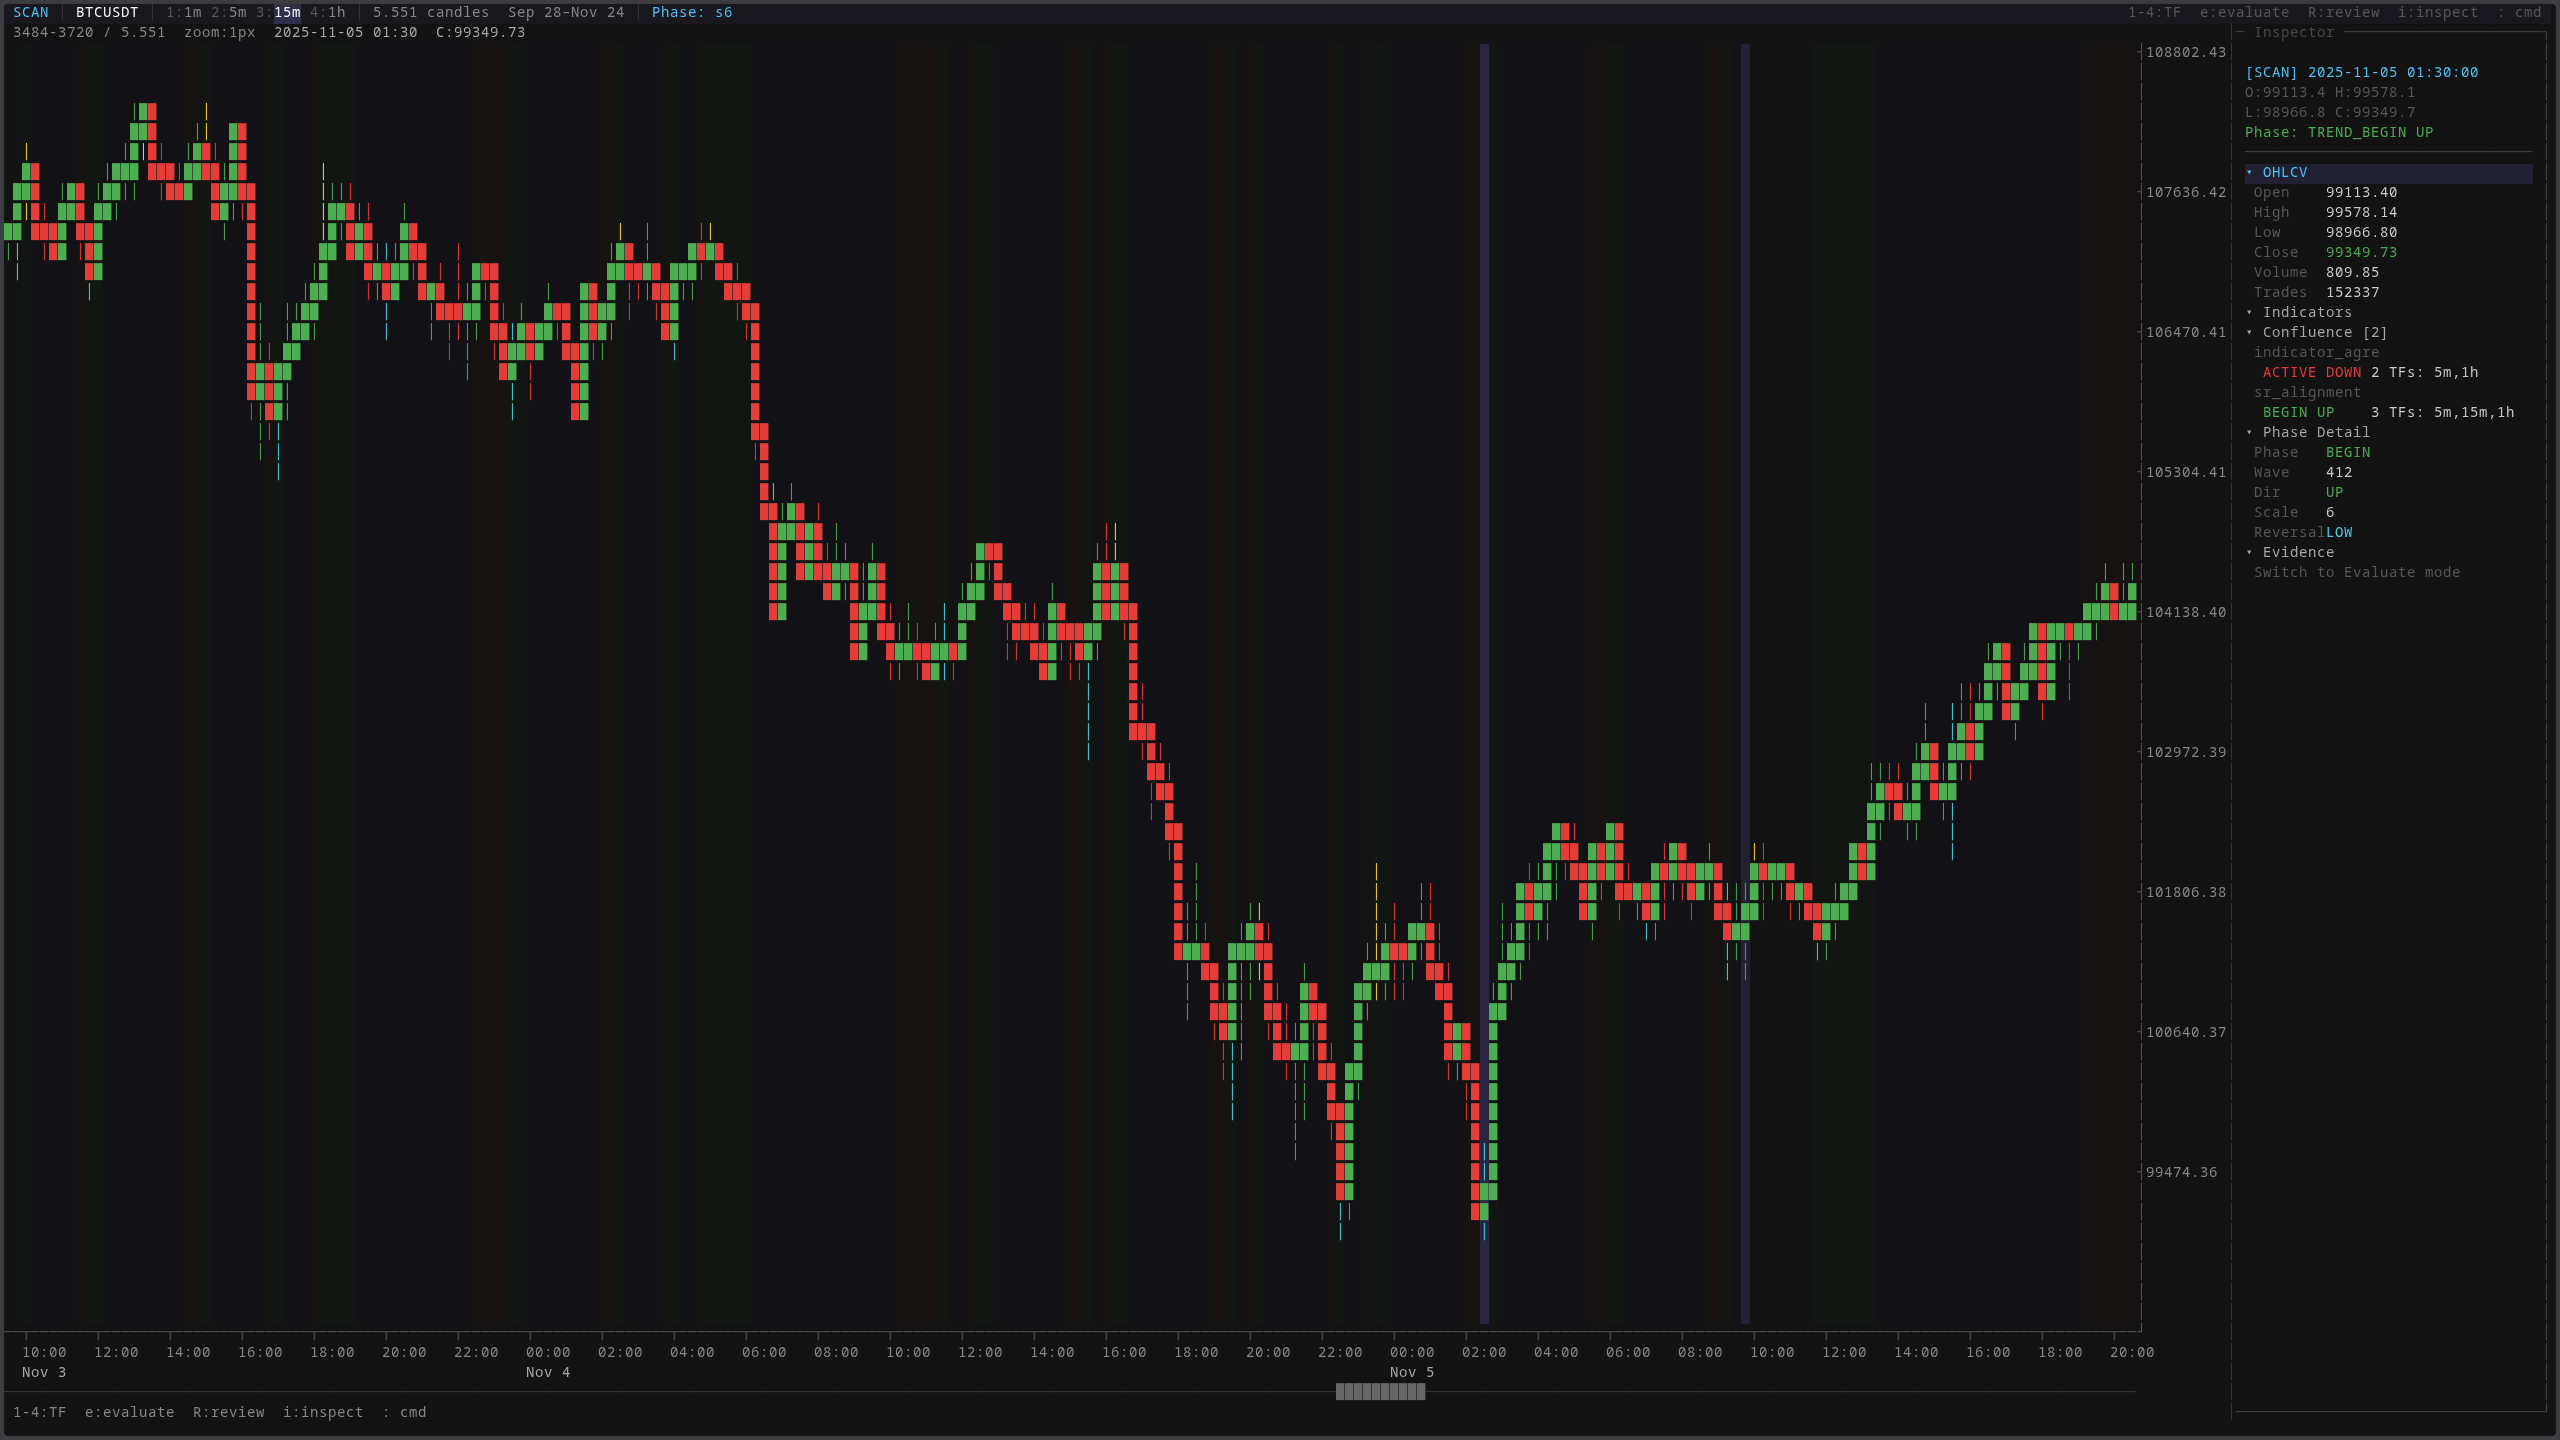
The inspector panel breaks down what the system knows about any given moment: which phase the market is in, what the indicators say, how many timeframes agree on direction, and what the evidence suggests. Every field here is computed deterministically. No interpretation, no ambiguity.
The oracle: measuring the ceiling (V4)
This was the turning point. I built an “oracle”, a perfect trader that sees the future. It knows every price movement before it happens and enters and exits at the mathematically optimal moments. Impossible to run in production, but invaluable as an upper bound. If the oracle can’t profit in a given configuration, no strategy can.
The oracle revealed that the system’s original configuration had a structurally negative envelope. Even perfect trading couldn’t overcome the fee drag. Months of prior research had been optimizing inside an impossible box, tuning indicators and thresholds for a game that was already lost.
That discovery invalidated hundreds of experiment runs. It also saved the project, because everything that came after was built on a sound foundation.
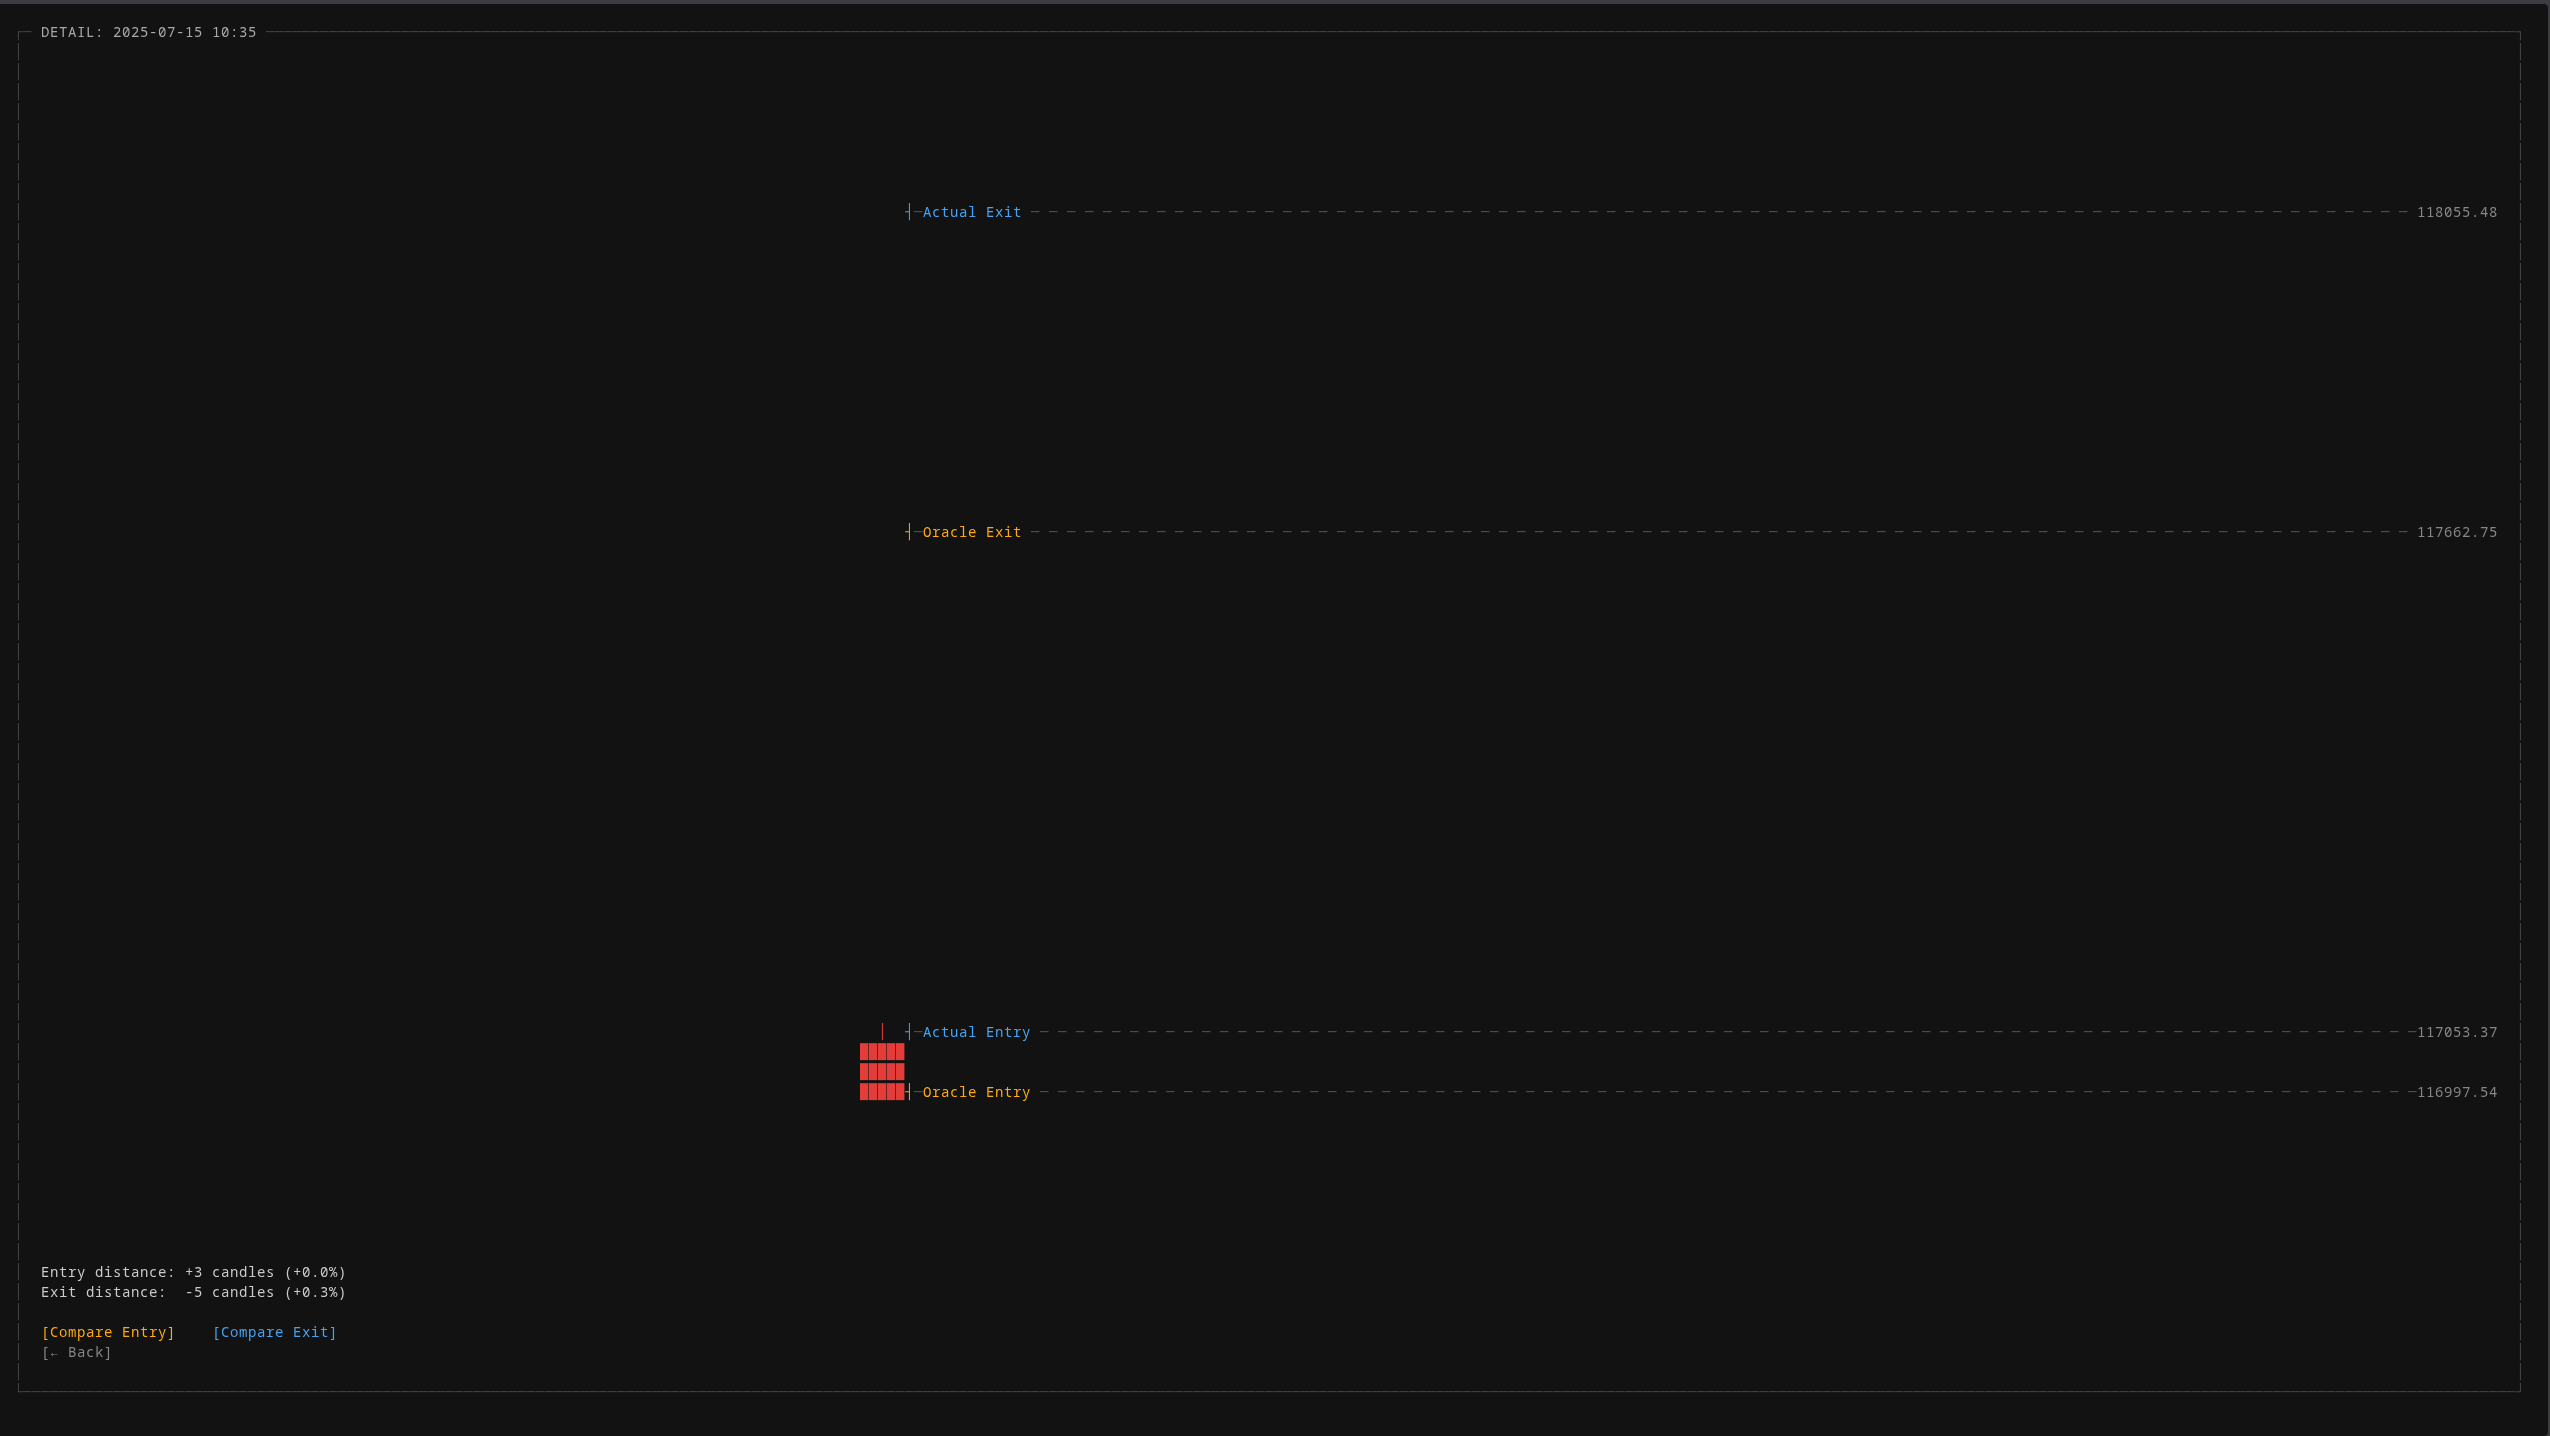
The oracle comparison view shows exactly how far each real trade deviates from the theoretical optimum. Entry distance, exit distance, and price difference. All measured in candles and percentages, not feelings.
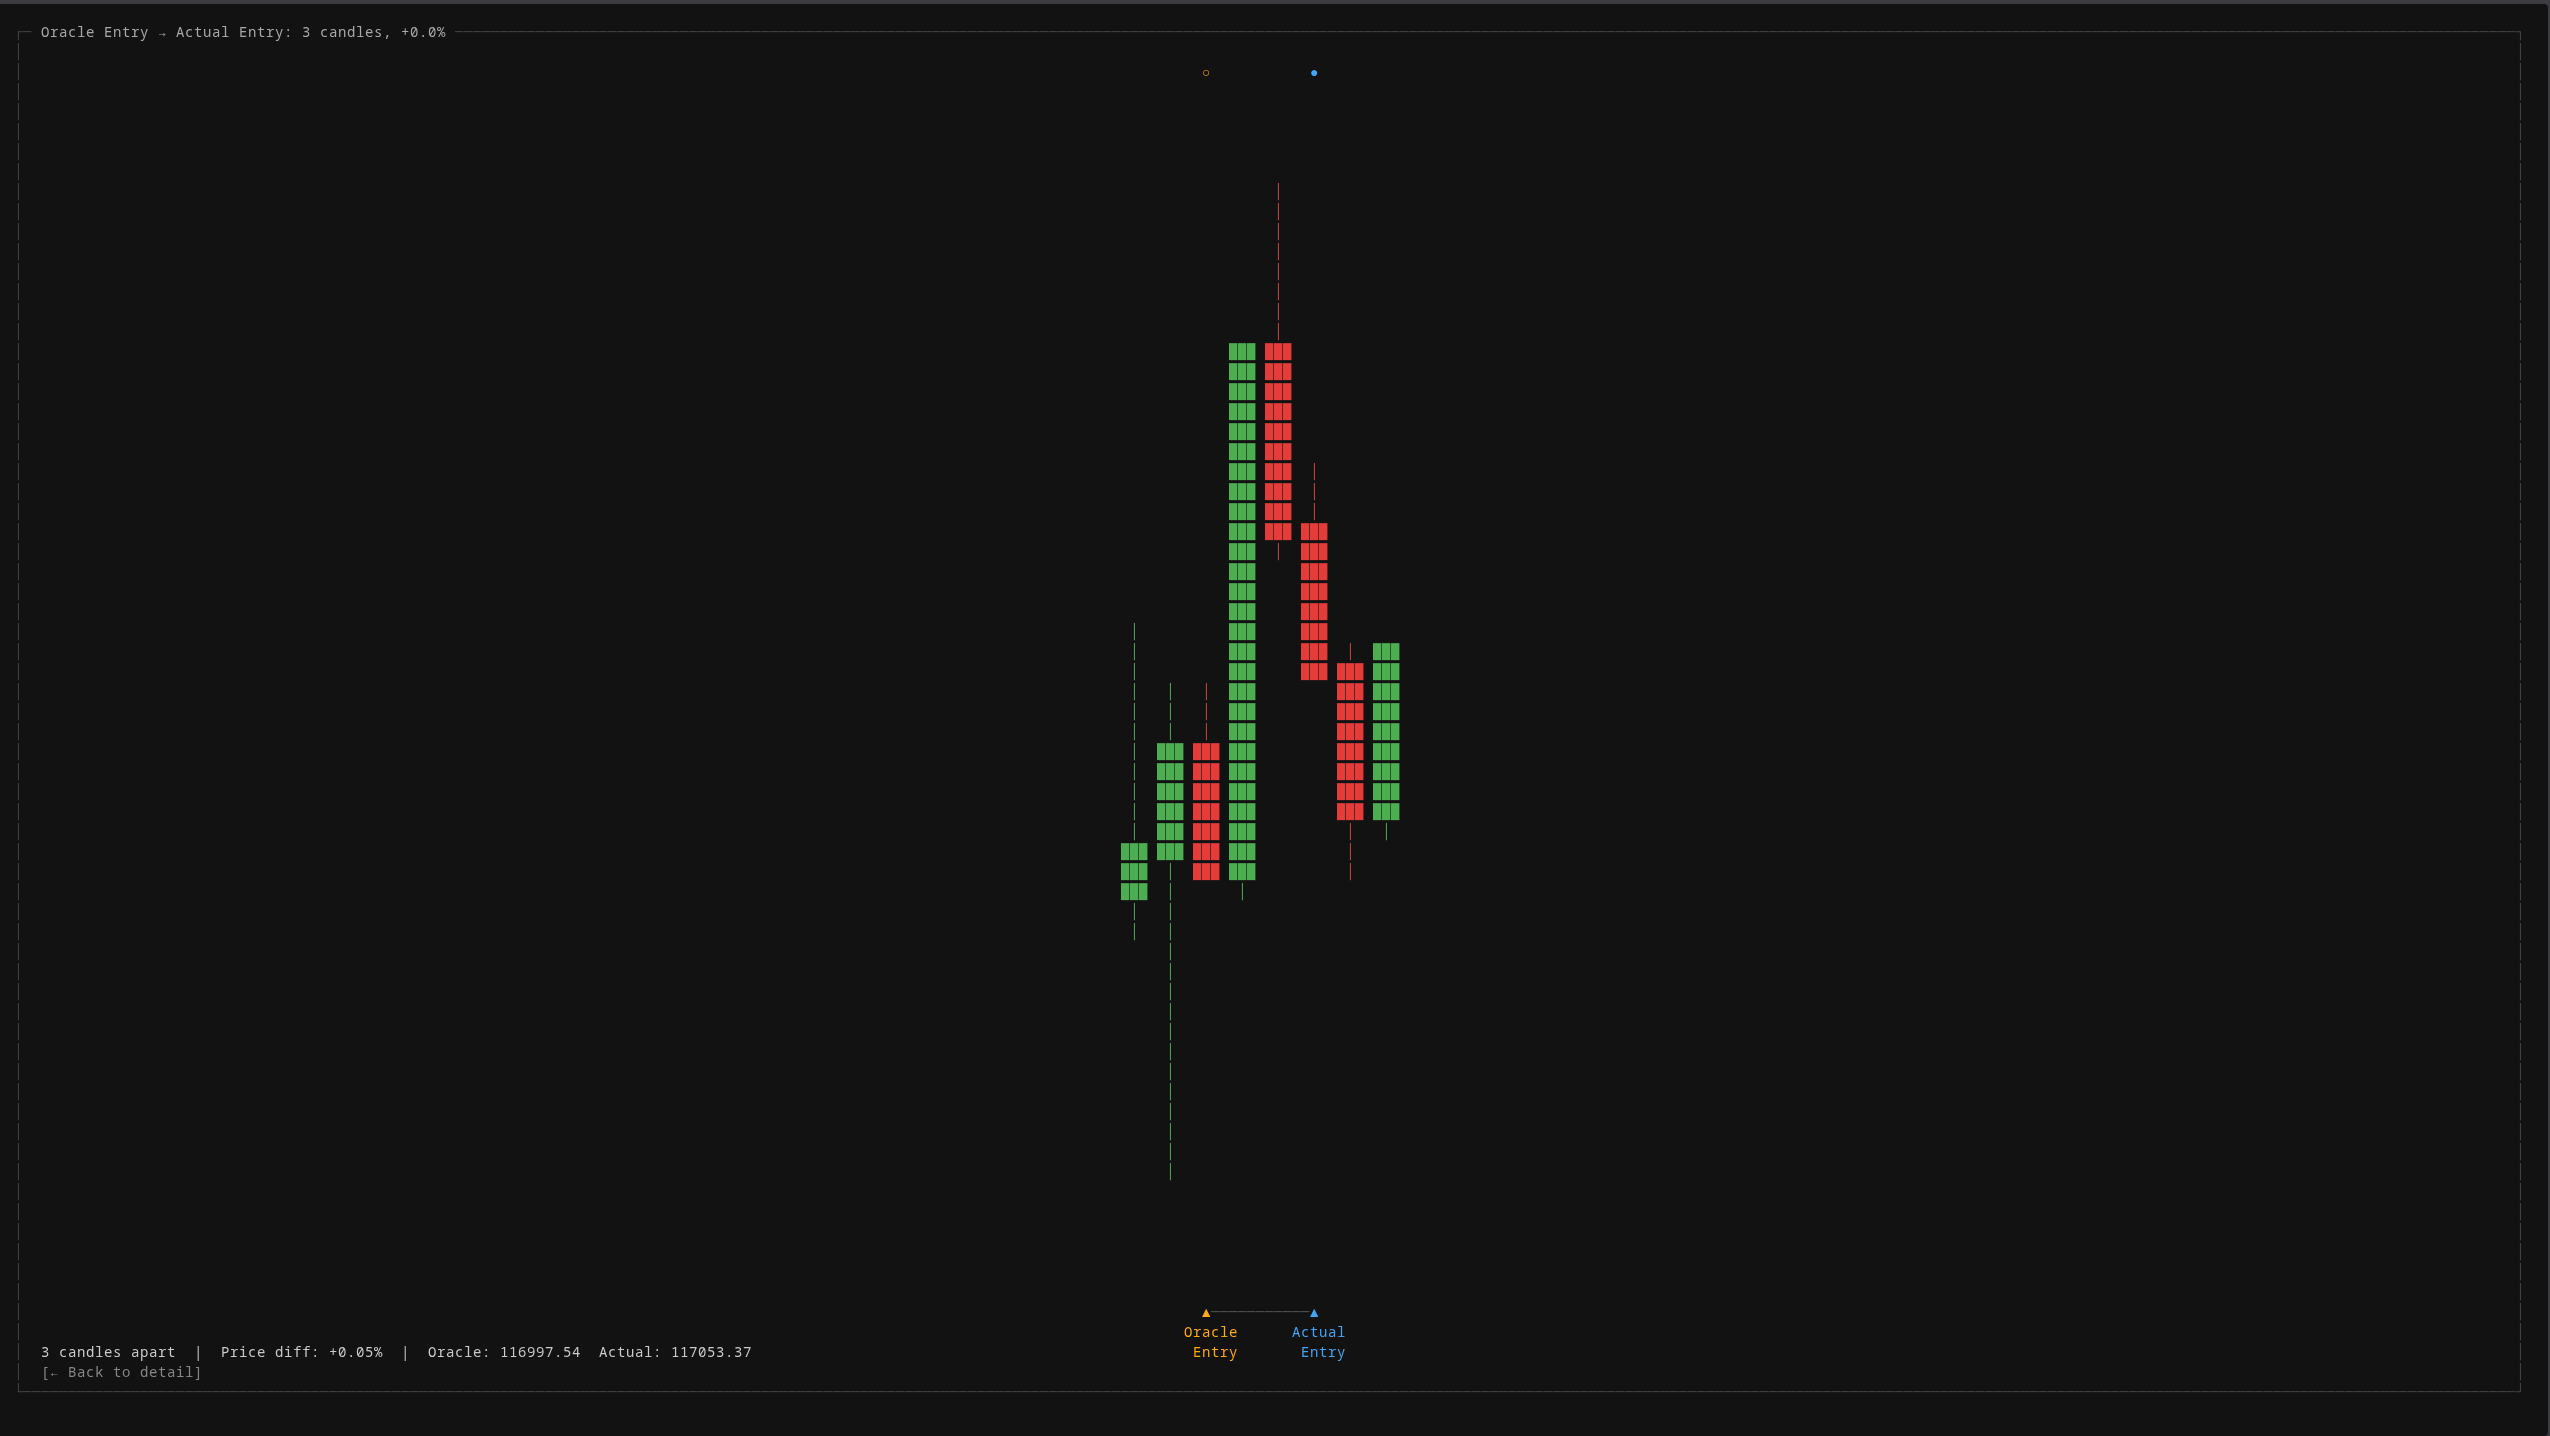
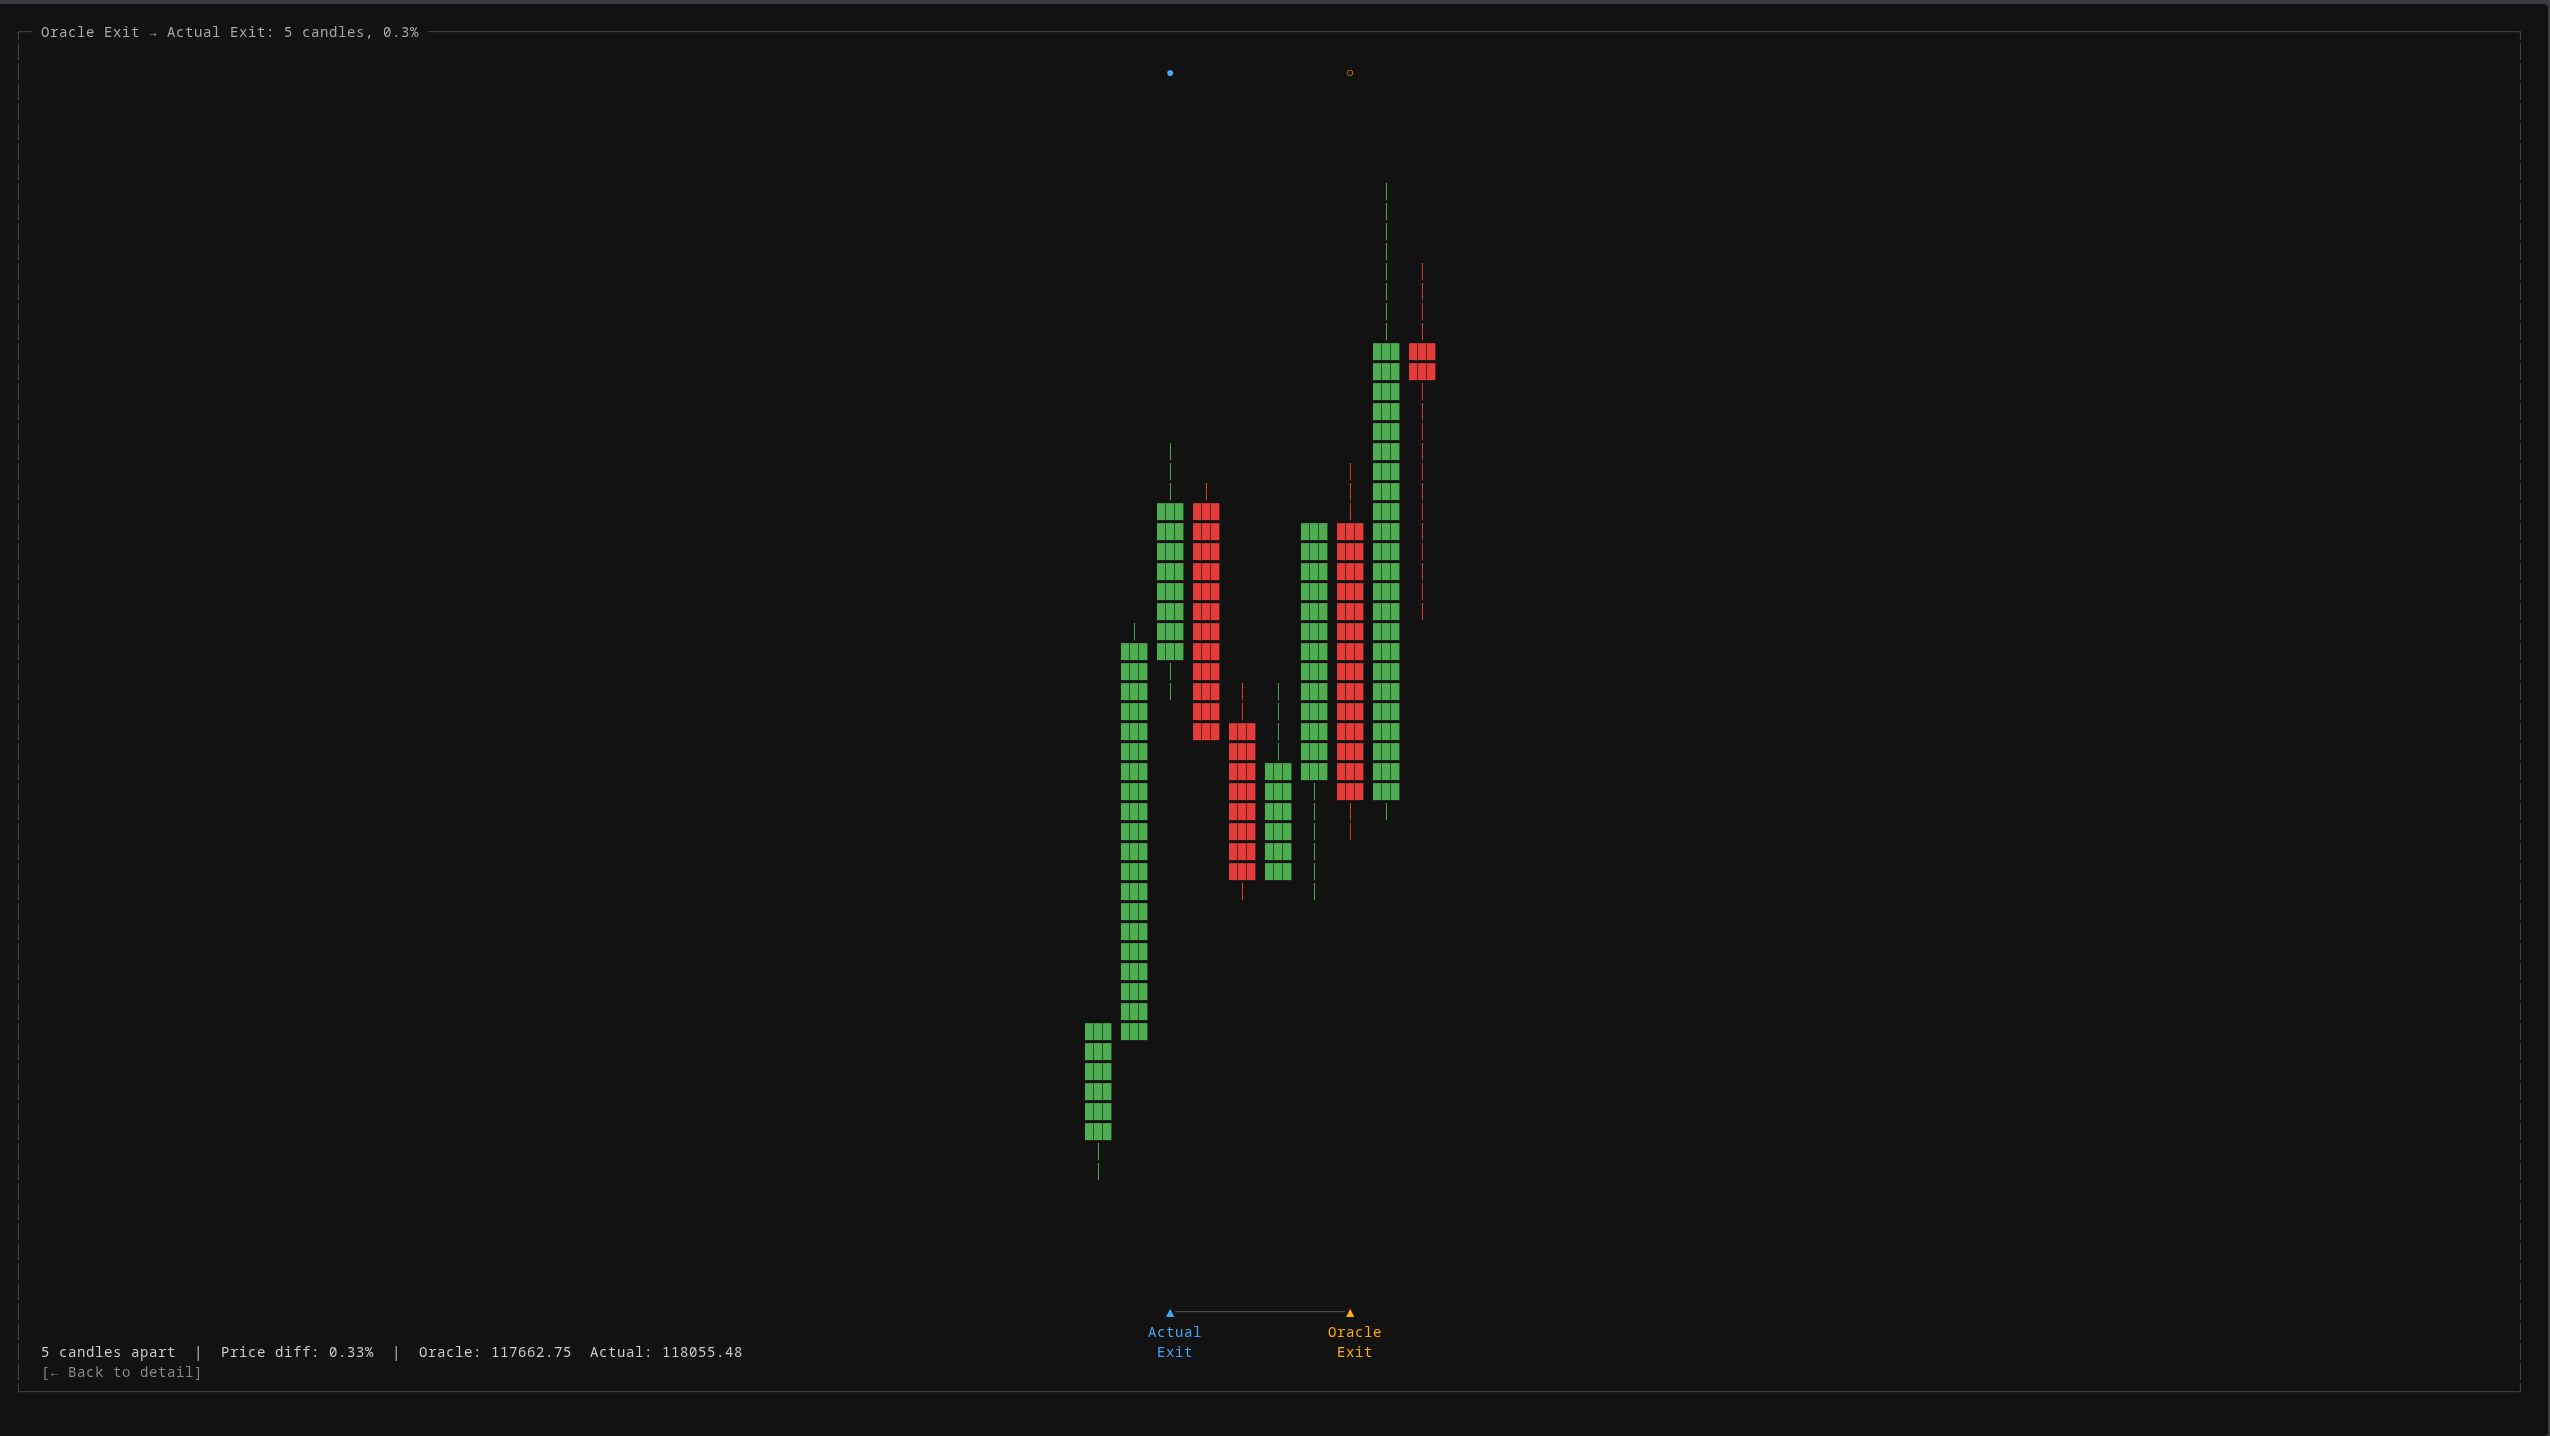
These zoomed comparison views let you visually inspect every single trade against the perfect baseline. When the system enters 3 candles after the oracle, you can see exactly what happened in those 3 candles and ask: was there enough information to have entered earlier?
Signal intelligence: what does the data actually contain? (V5 to V8)
With the structural problem fixed, the next question was: what information actually exists in market data, and how much of it is exploitable?
I built six independent signal layers, each measuring a different dimension of market state:
- Volume pressure: cumulative buying vs selling force, divergence detection, momentum deceleration
- Aggressor ratios: who’s initiating trades, how that’s shifting over time
- Key price levels: round numbers, session boundaries, prior day extremes, and whether price breaches or rejects them
- Higher-timeframe context: what’s the daily and multi-day trend doing while you’re looking at short-term candles
- Relative volume: is current volume unusual compared to the same time window over the past week
- News attention: external event intensity and sentiment
Each signal is computed per candle, stored in the database, and statistically tested across over a thousand trades. Not “this indicator looks like it correlates.” Actual hypothesis testing with p-values. Some signals that look predictive on a chart turn out to be noise. Others that seem irrelevant carry statistically significant edge.
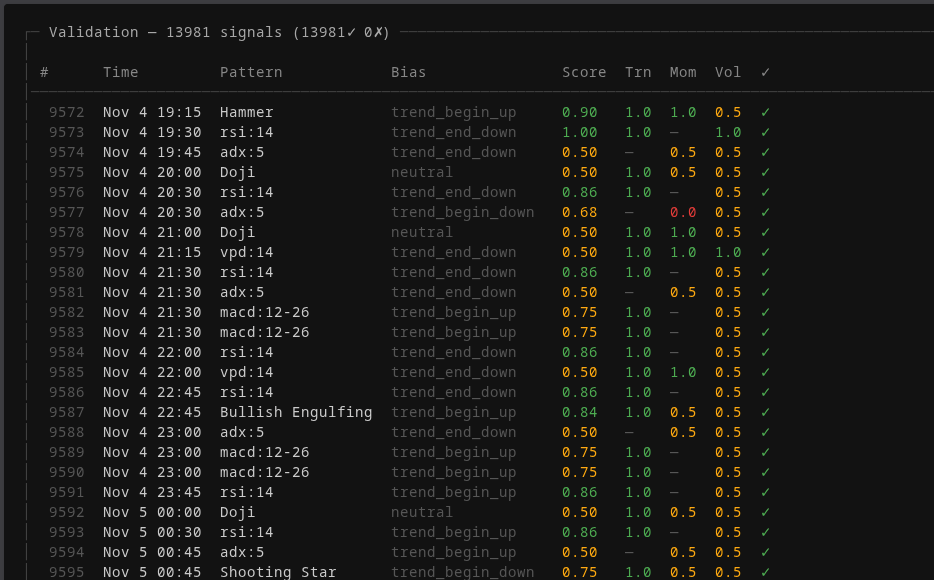
Every signal the system detects is validated against three independent dimensions: trend alignment, momentum confirmation, and volume support. Green means the dimension confirms the signal. The composite score determines whether the signal is actionable or noise.
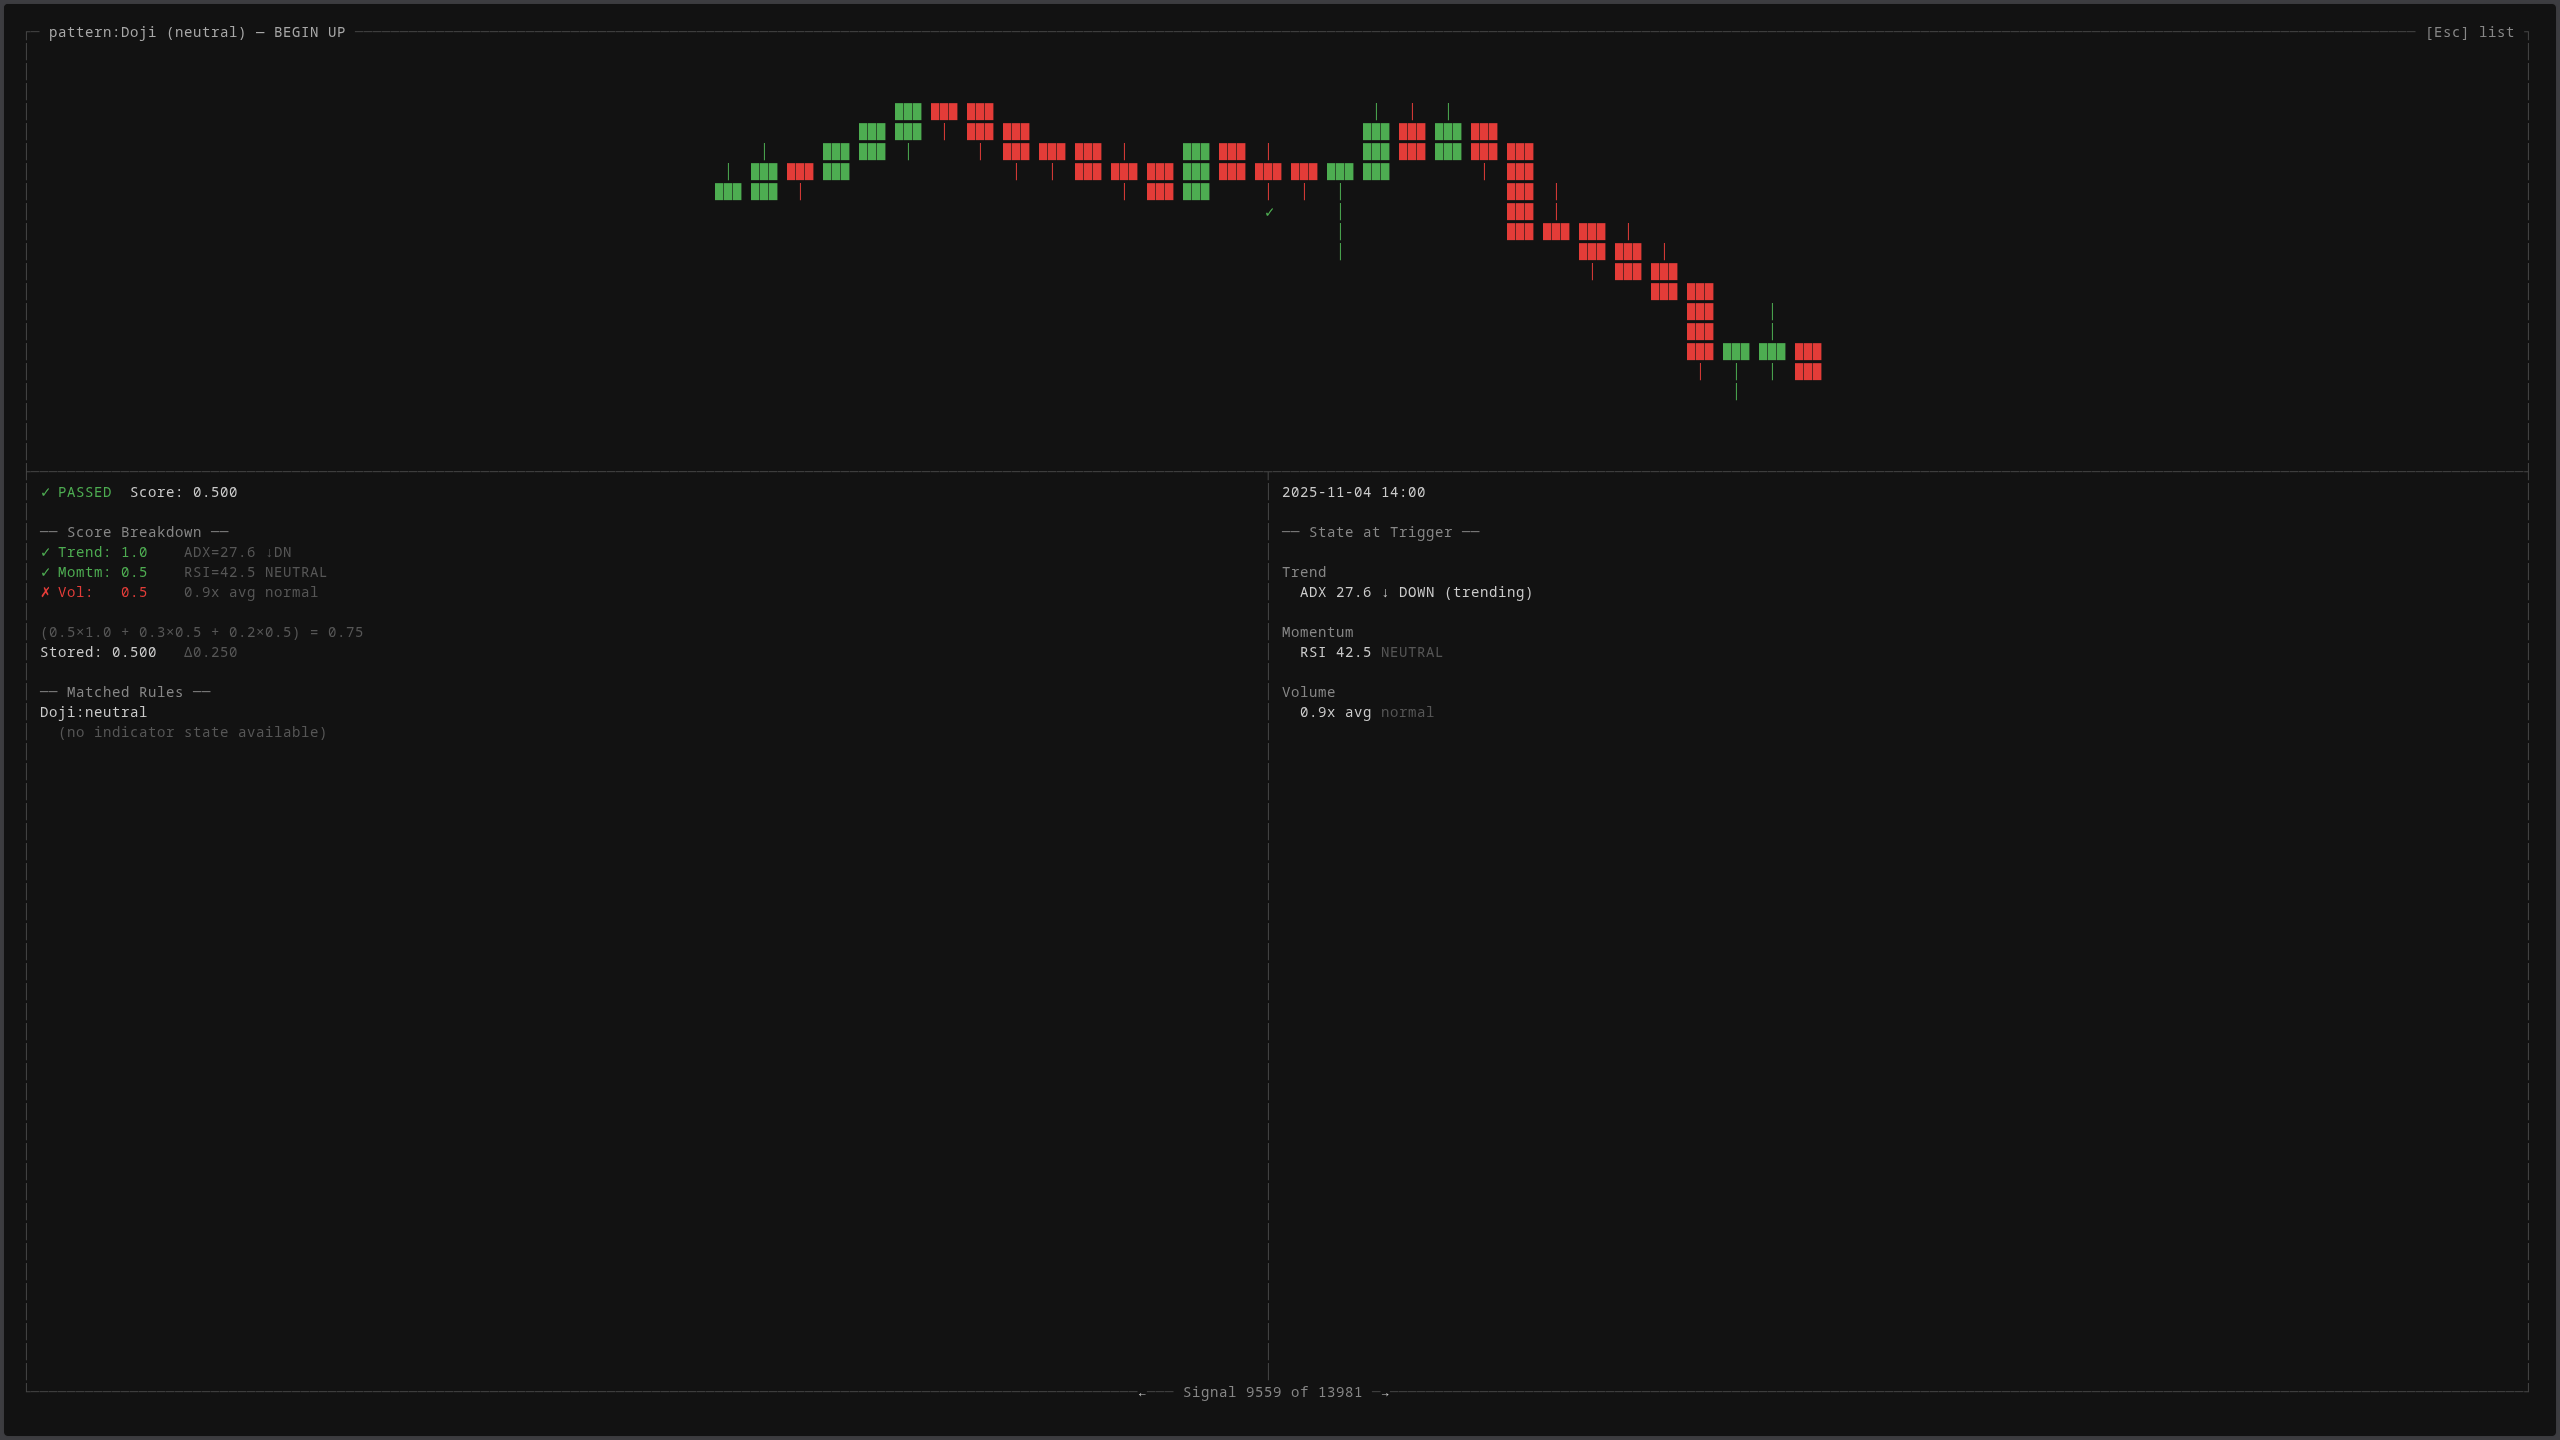
Drilling into a single signal reveals the full context: what pattern was detected, what the market state looked like at the moment of trigger (ADX trending down, RSI neutral, volume at 0.9x average), the weighted score calculation, and the matched rules. This level of forensic detail is what separates “I think this works” from “I can prove this works.”
As a validation experiment, I fed all six layers as structured context to an AI model. It achieved perfect directional accuracy across multiple market regimes: quiet consolidation, flash crashes, V-shaped reversals. That proved the signals contain the information. The challenge was never “is there signal in the data?” It was: “can you codify that signal into deterministic rules that survive realistic conditions?”
The Strategy Graveyard
I systematically tested over twenty strategy families across six timeframes, from five-minute scalping to eight-hour swing trading. Each one was evaluated under progressively harsher conditions: first with optimistic fees, then with realistic production fees, then with walk-forward validation on unseen data.
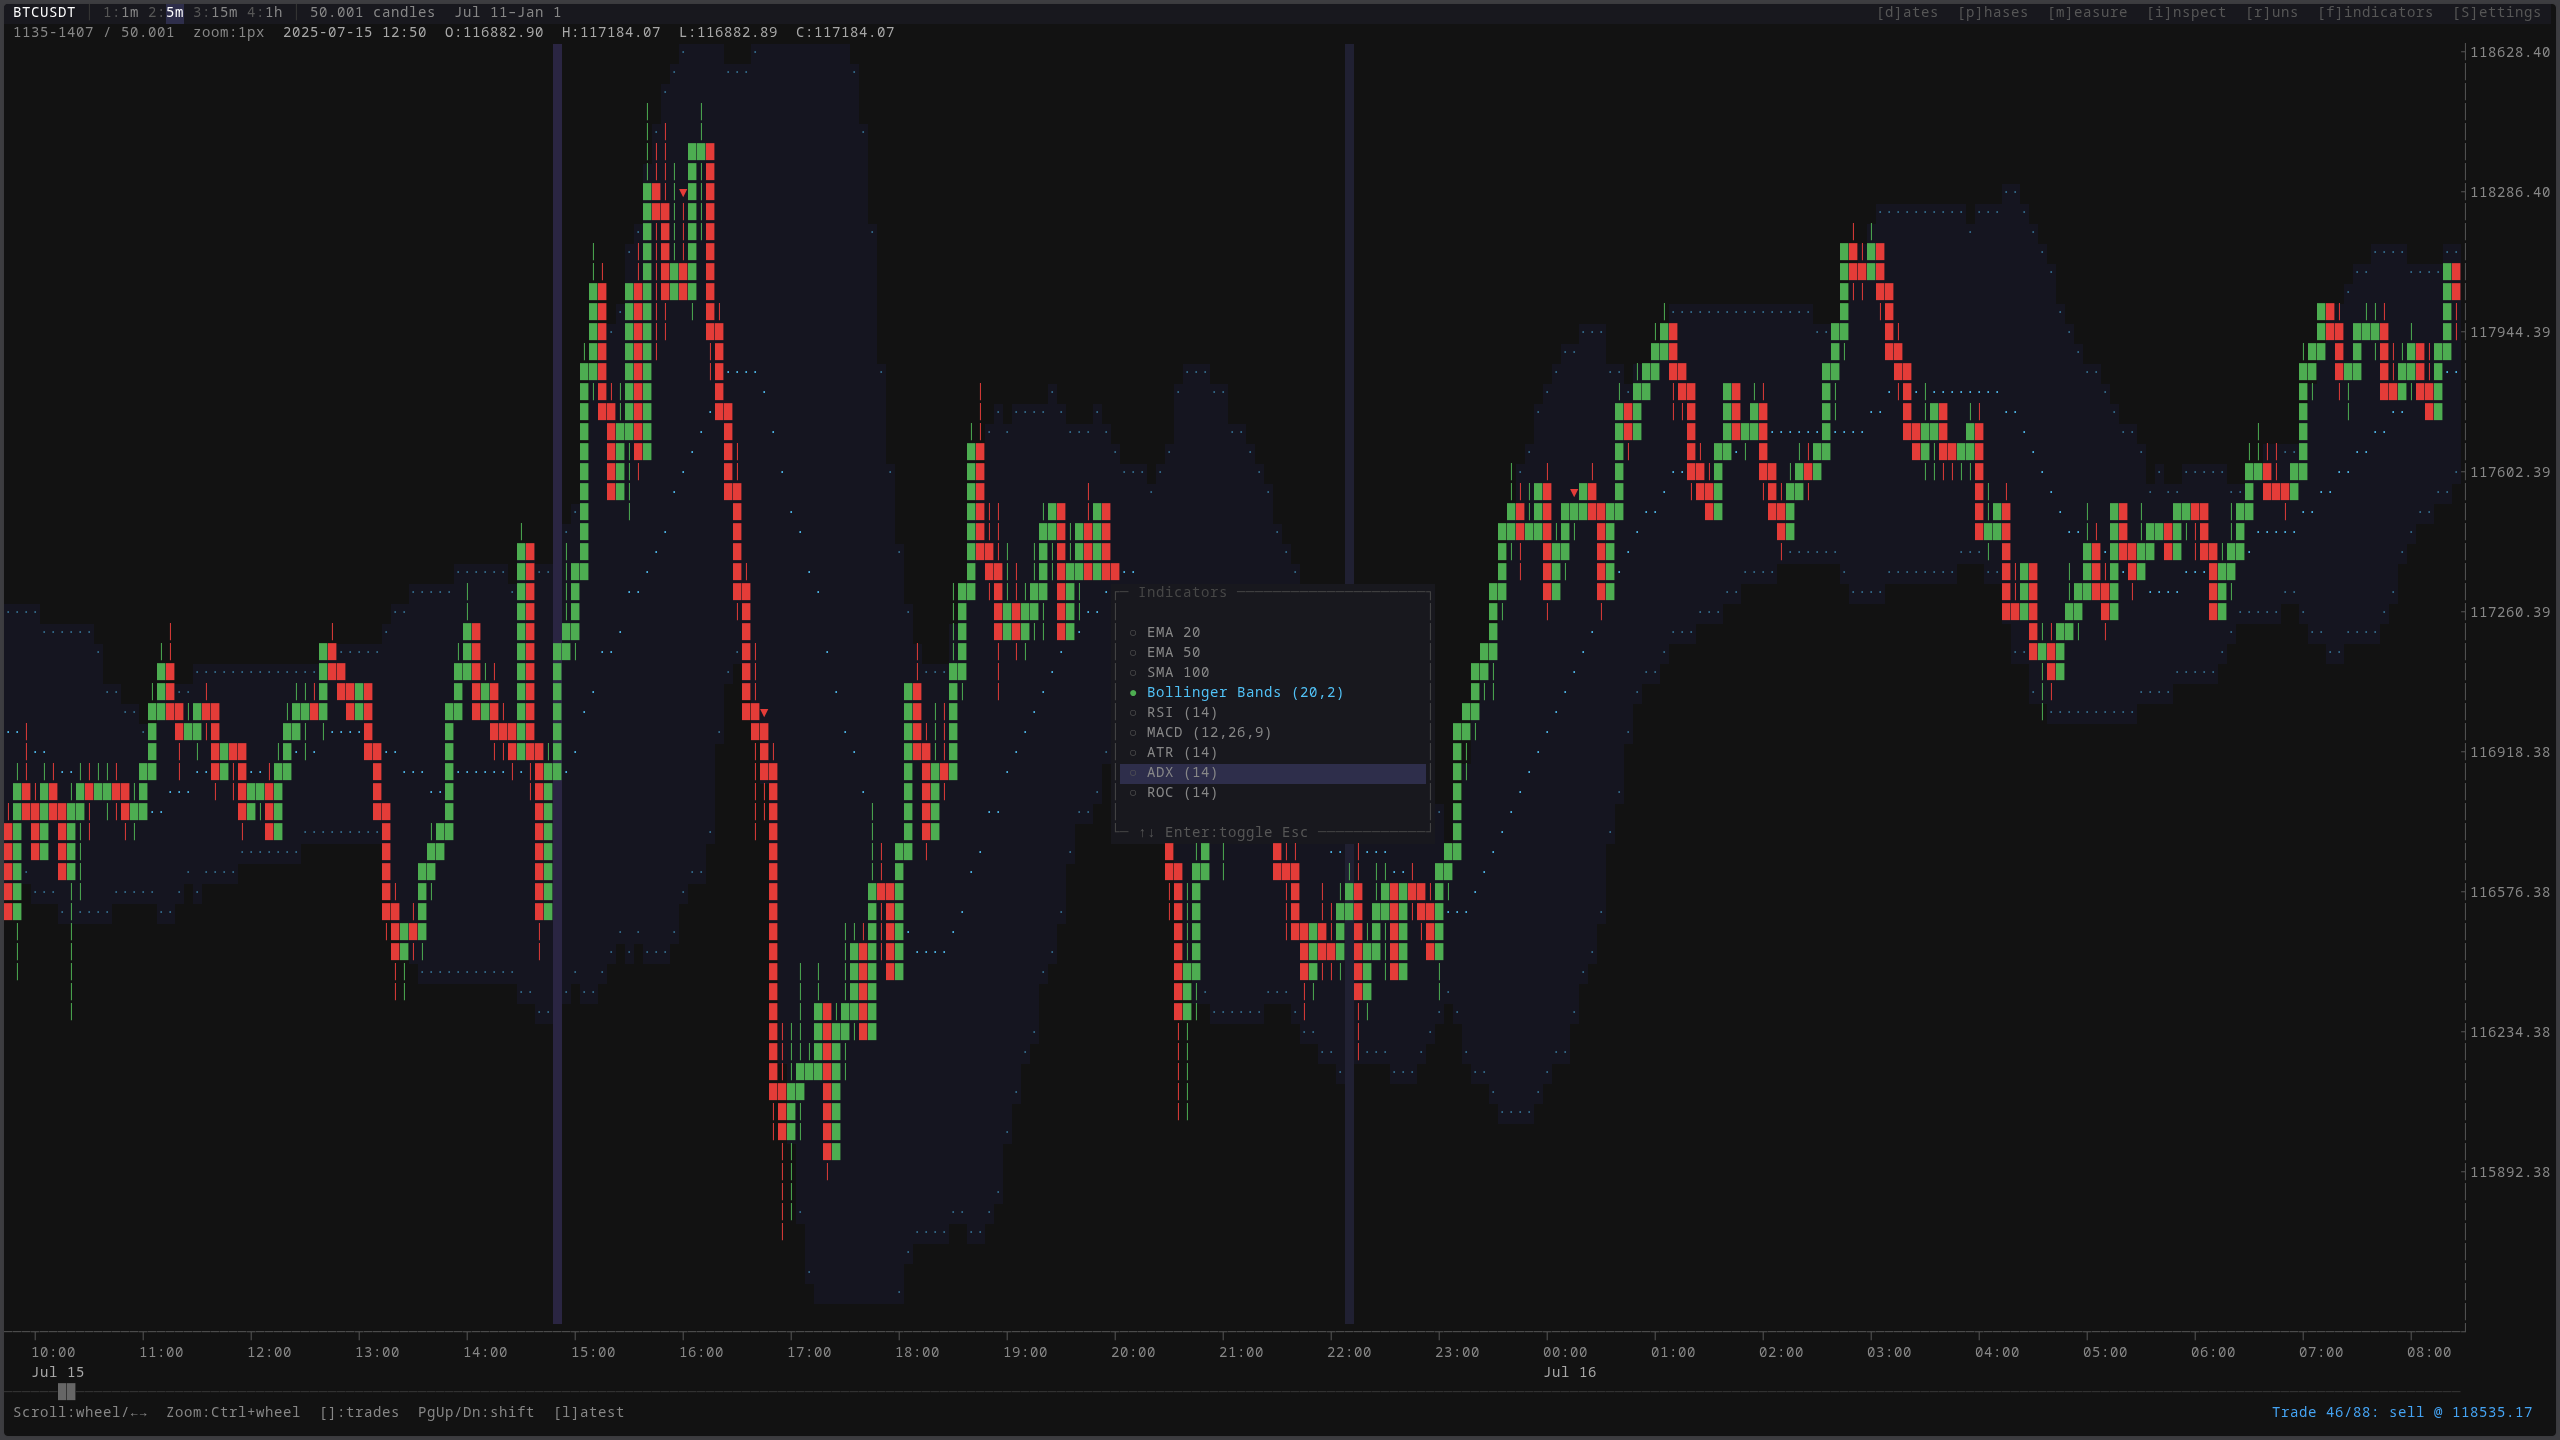
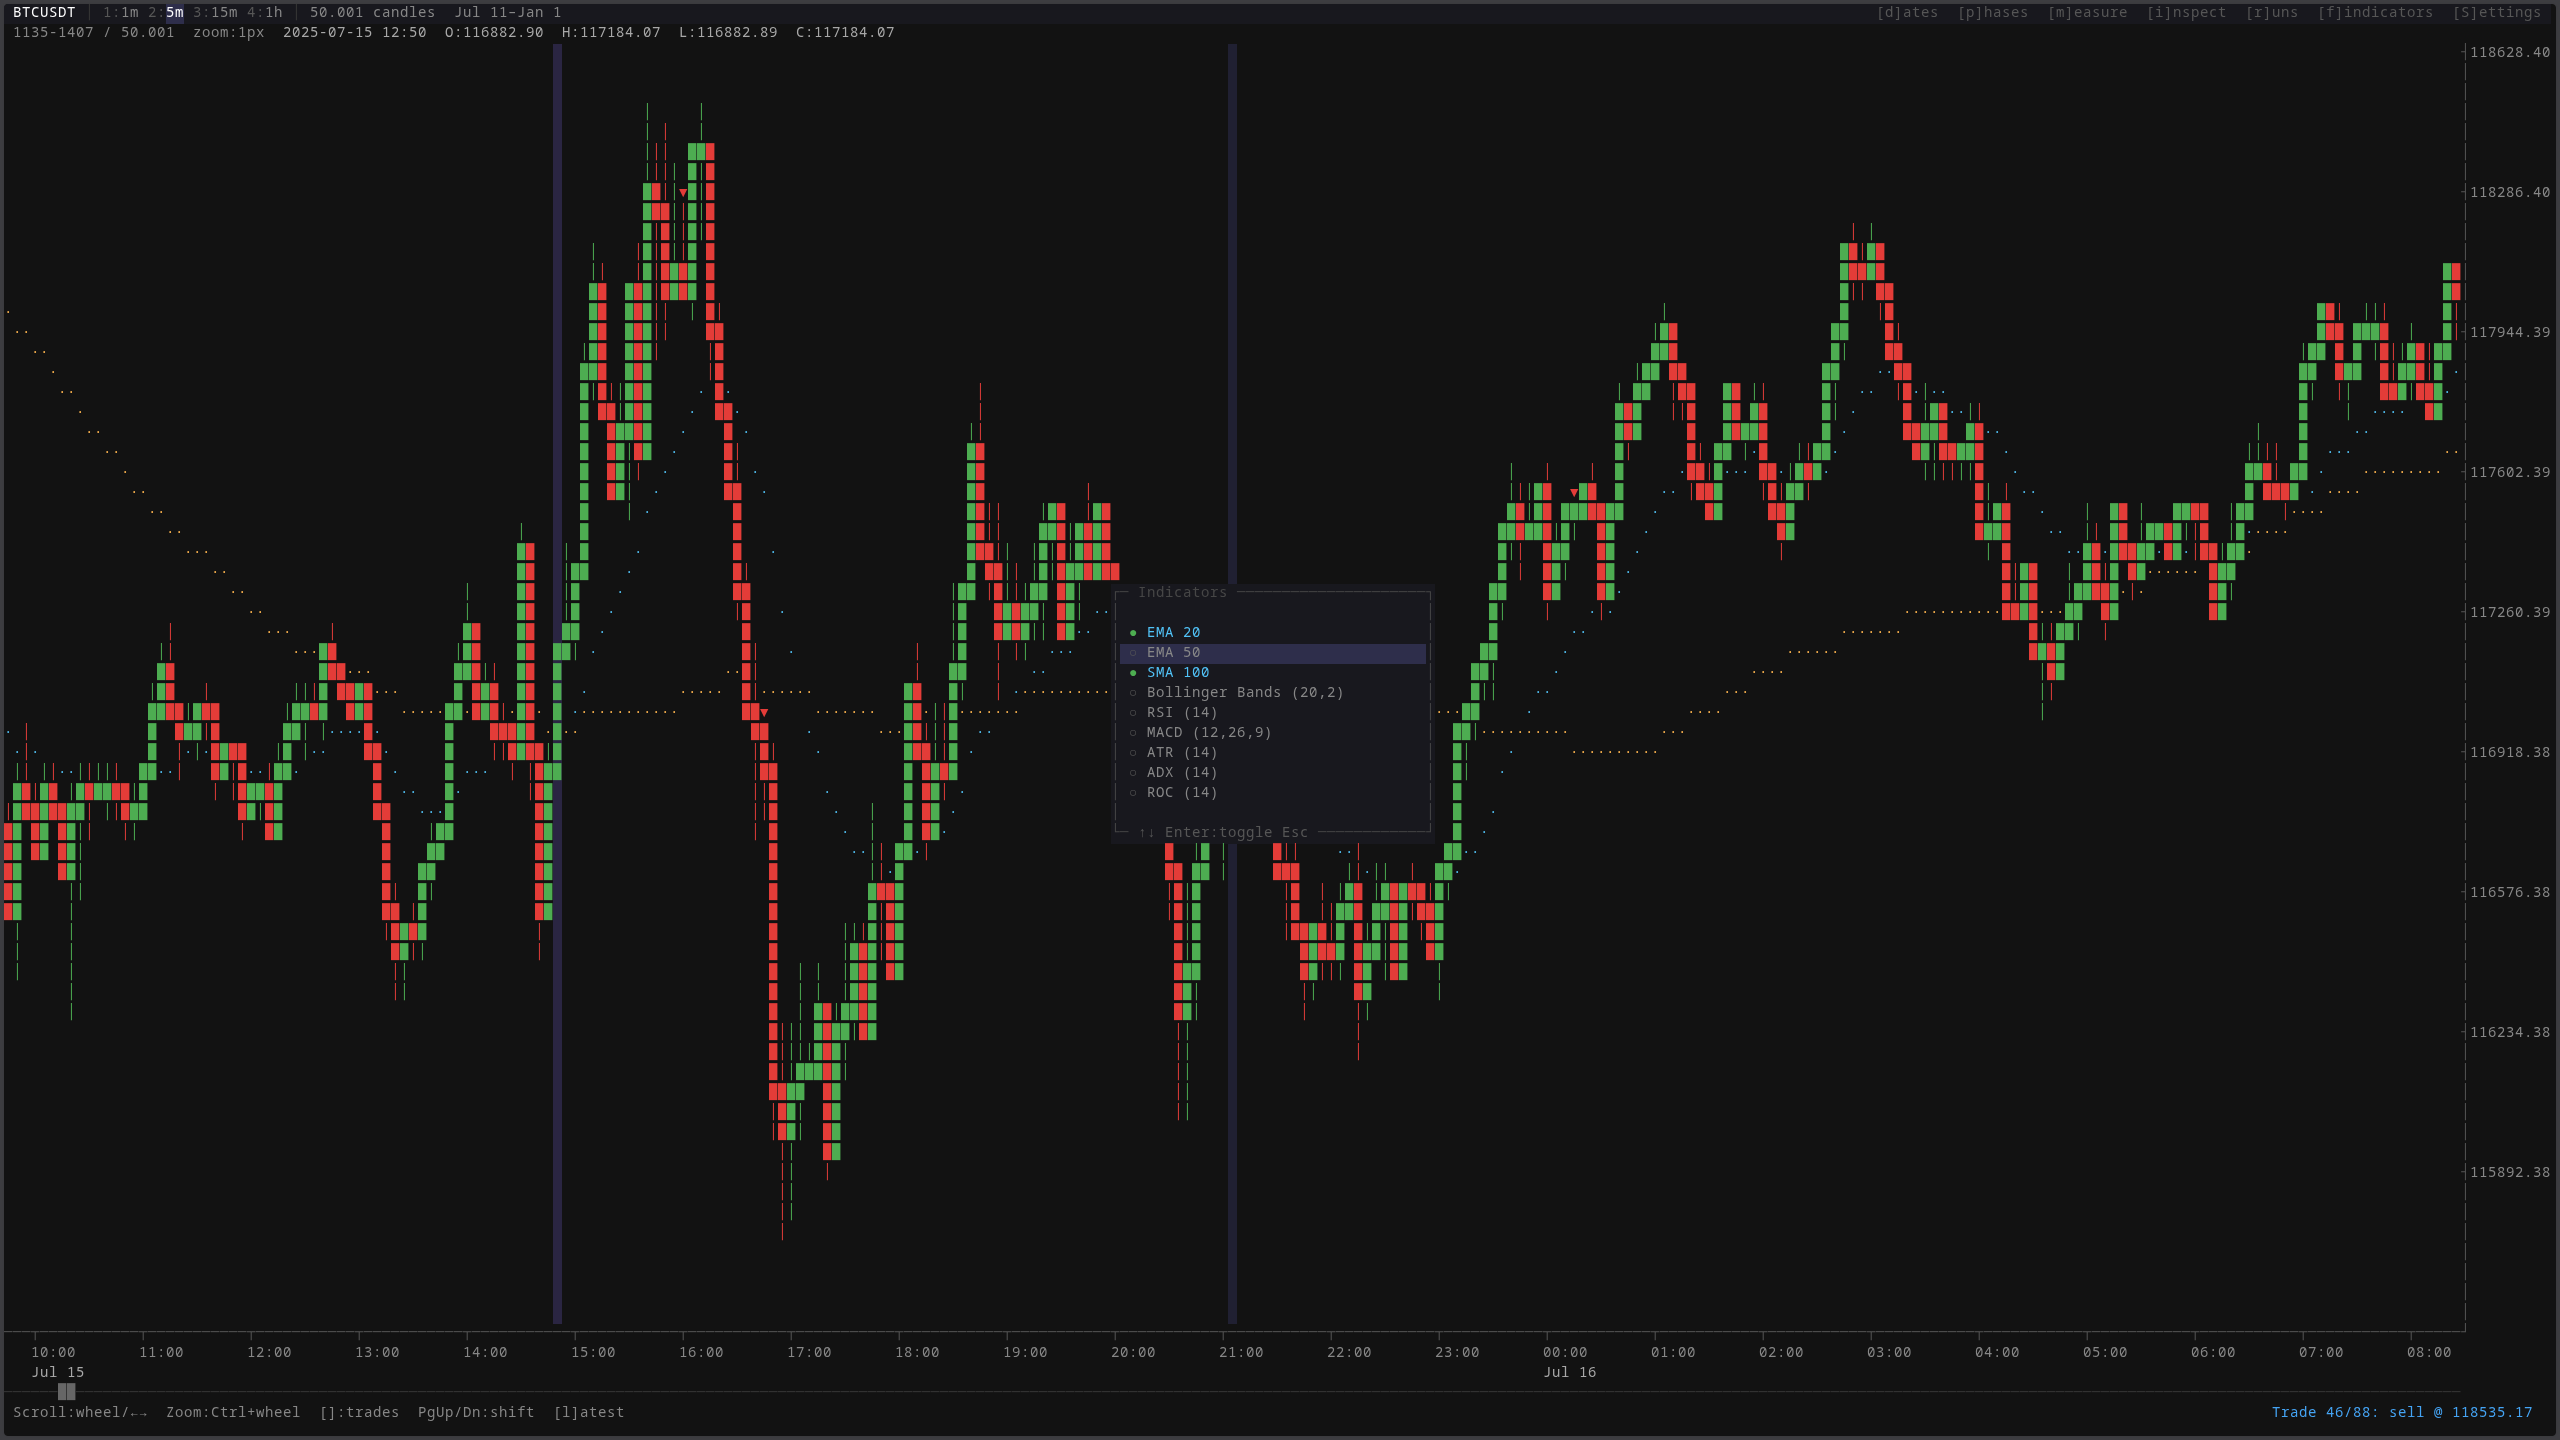
Every combination of indicators, every timeframe, every parameter range. Tested systematically, not cherry-picked. The indicator overlay shows just a fraction of what was explored. Most of it ended up in the graveyard.
Nearly every strategy that looked profitable under optimistic assumptions died when switching to realistic fee levels. This is the dirty secret of retail algorithmic trading: most published “profitable strategies” are an illusion created by underestimating transaction costs. A strategy that nets 0.15% per trade sounds profitable until you realize fees alone cost 0.20-0.30% round trip.
One strategy family survived. I’m not going to detail what it does, but the key insight wasn’t about finding the right indicator. It was about finding the right timeframe. Shorter timeframes produce more signals but each signal carries less edge relative to fees. The winning strategy trades infrequently but with structural mathematical reasoning behind each entry.
Walk-forward validated: train on historical data, test on a future window the system has never seen, slide the window forward, repeat. Positive across every out-of-sample period.
Validation: The Art of Not Fooling Yourself
The real engineering challenge in trading isn’t finding something that works on historical data. It’s building enough infrastructure to be confident that what works on historical data will work in the future.
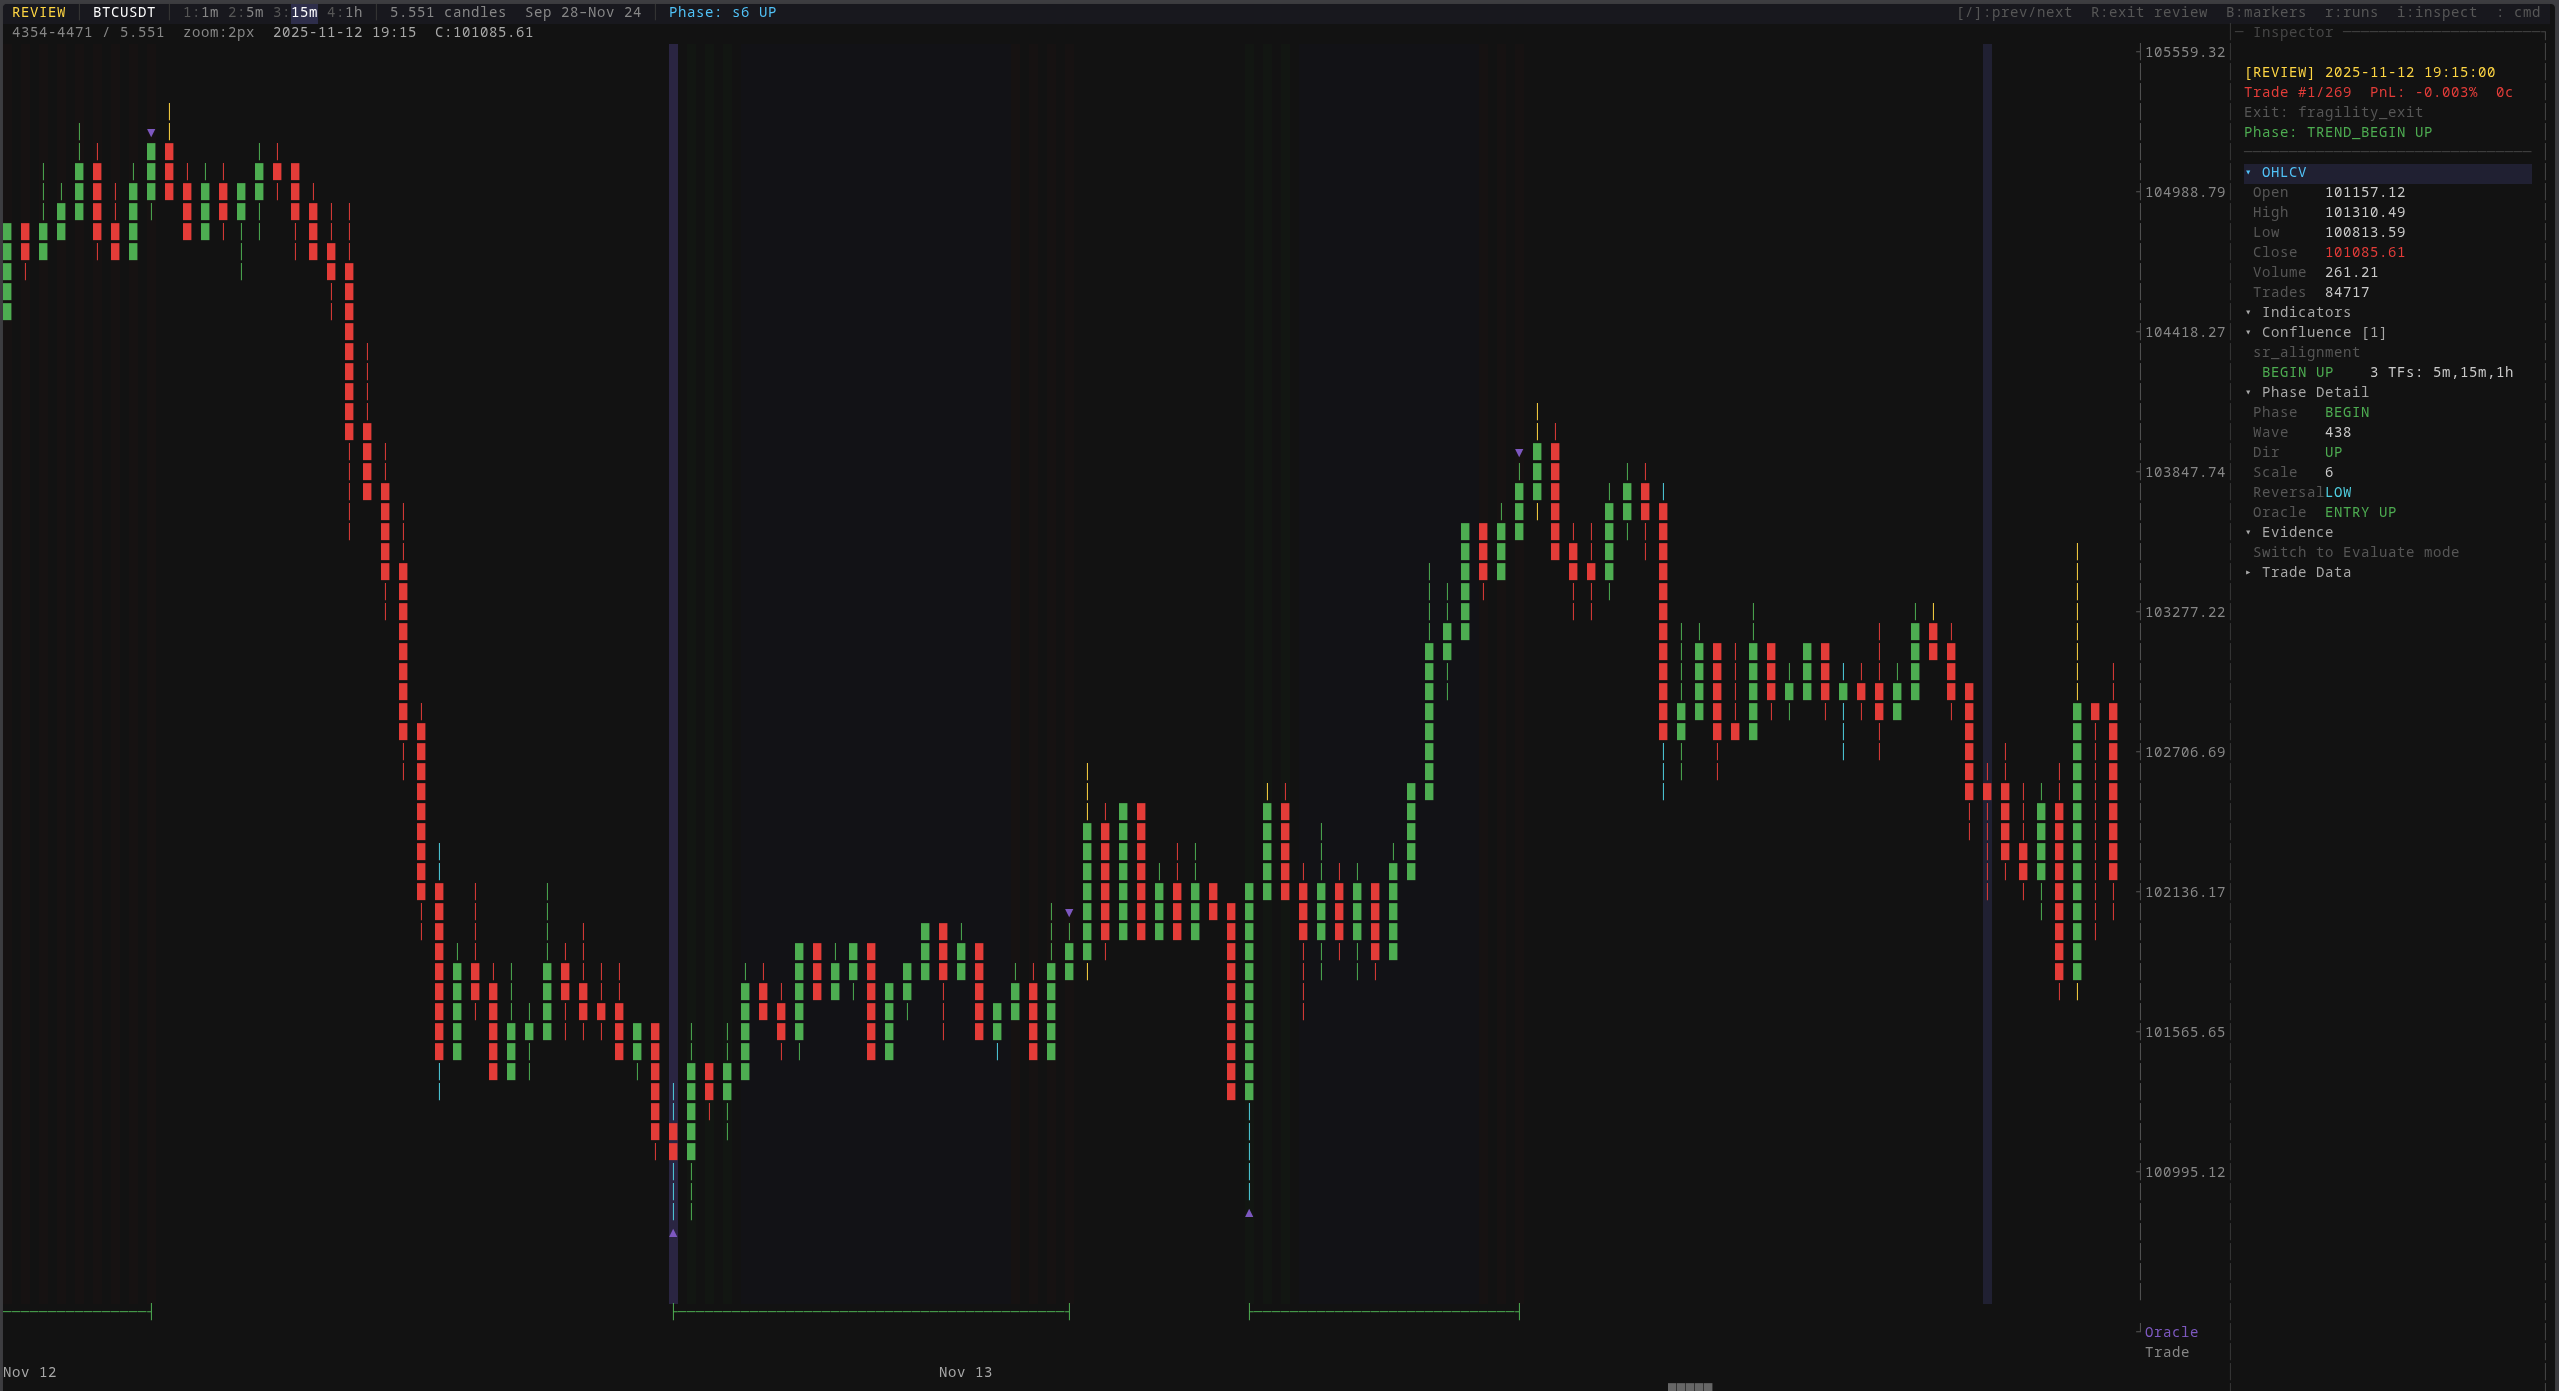
The review mode lets you step through every trade the system has ever taken. For each one: the entry and exit prices, which phase the market was in, how many timeframes confirmed direction, where the oracle would have entered instead, and how the trade ultimately resolved. Every trade is forensically auditable.
Walk-forward testing: the system trains on one window and tests on the next, repeatedly. If a strategy only works on the data it was tuned on, walk-forward testing catches it.
Oracle benchmarking: every strategy is measured against the theoretical maximum. If you’re capturing 3% of the available edge, you know exactly how much room there is to improve. If the ceiling is negative, you know to stop.
Position sizing analysis: Kelly criterion calculation to determine mathematically optimal bet sizes. Running at 100% capital per trade when the math says 38% is the optimal fraction is quantifiably reckless.
Exit mechanism research: the most counter-intuitive finding. Trailing stops, which feel safe, turned out to be the primary value destroyer. The majority of exits are stop-outs, and the majority of those stop-outs occur in trades that would have been profitable if held longer. The exit mechanism, not the entry, was destroying most of the edge.
The system is built to be hostile to its own results. Every component exists to catch a specific way the system might be lying to itself.
The Dashboard
A custom terminal-style UI built in TypeScript. No framework, just a purpose-built renderer. Candlestick charts with phase overlays, trade markers, and a keyboard-driven inspector panel. It exists because the research workflow demands fast, specific visualization that generic charting libraries don’t provide.
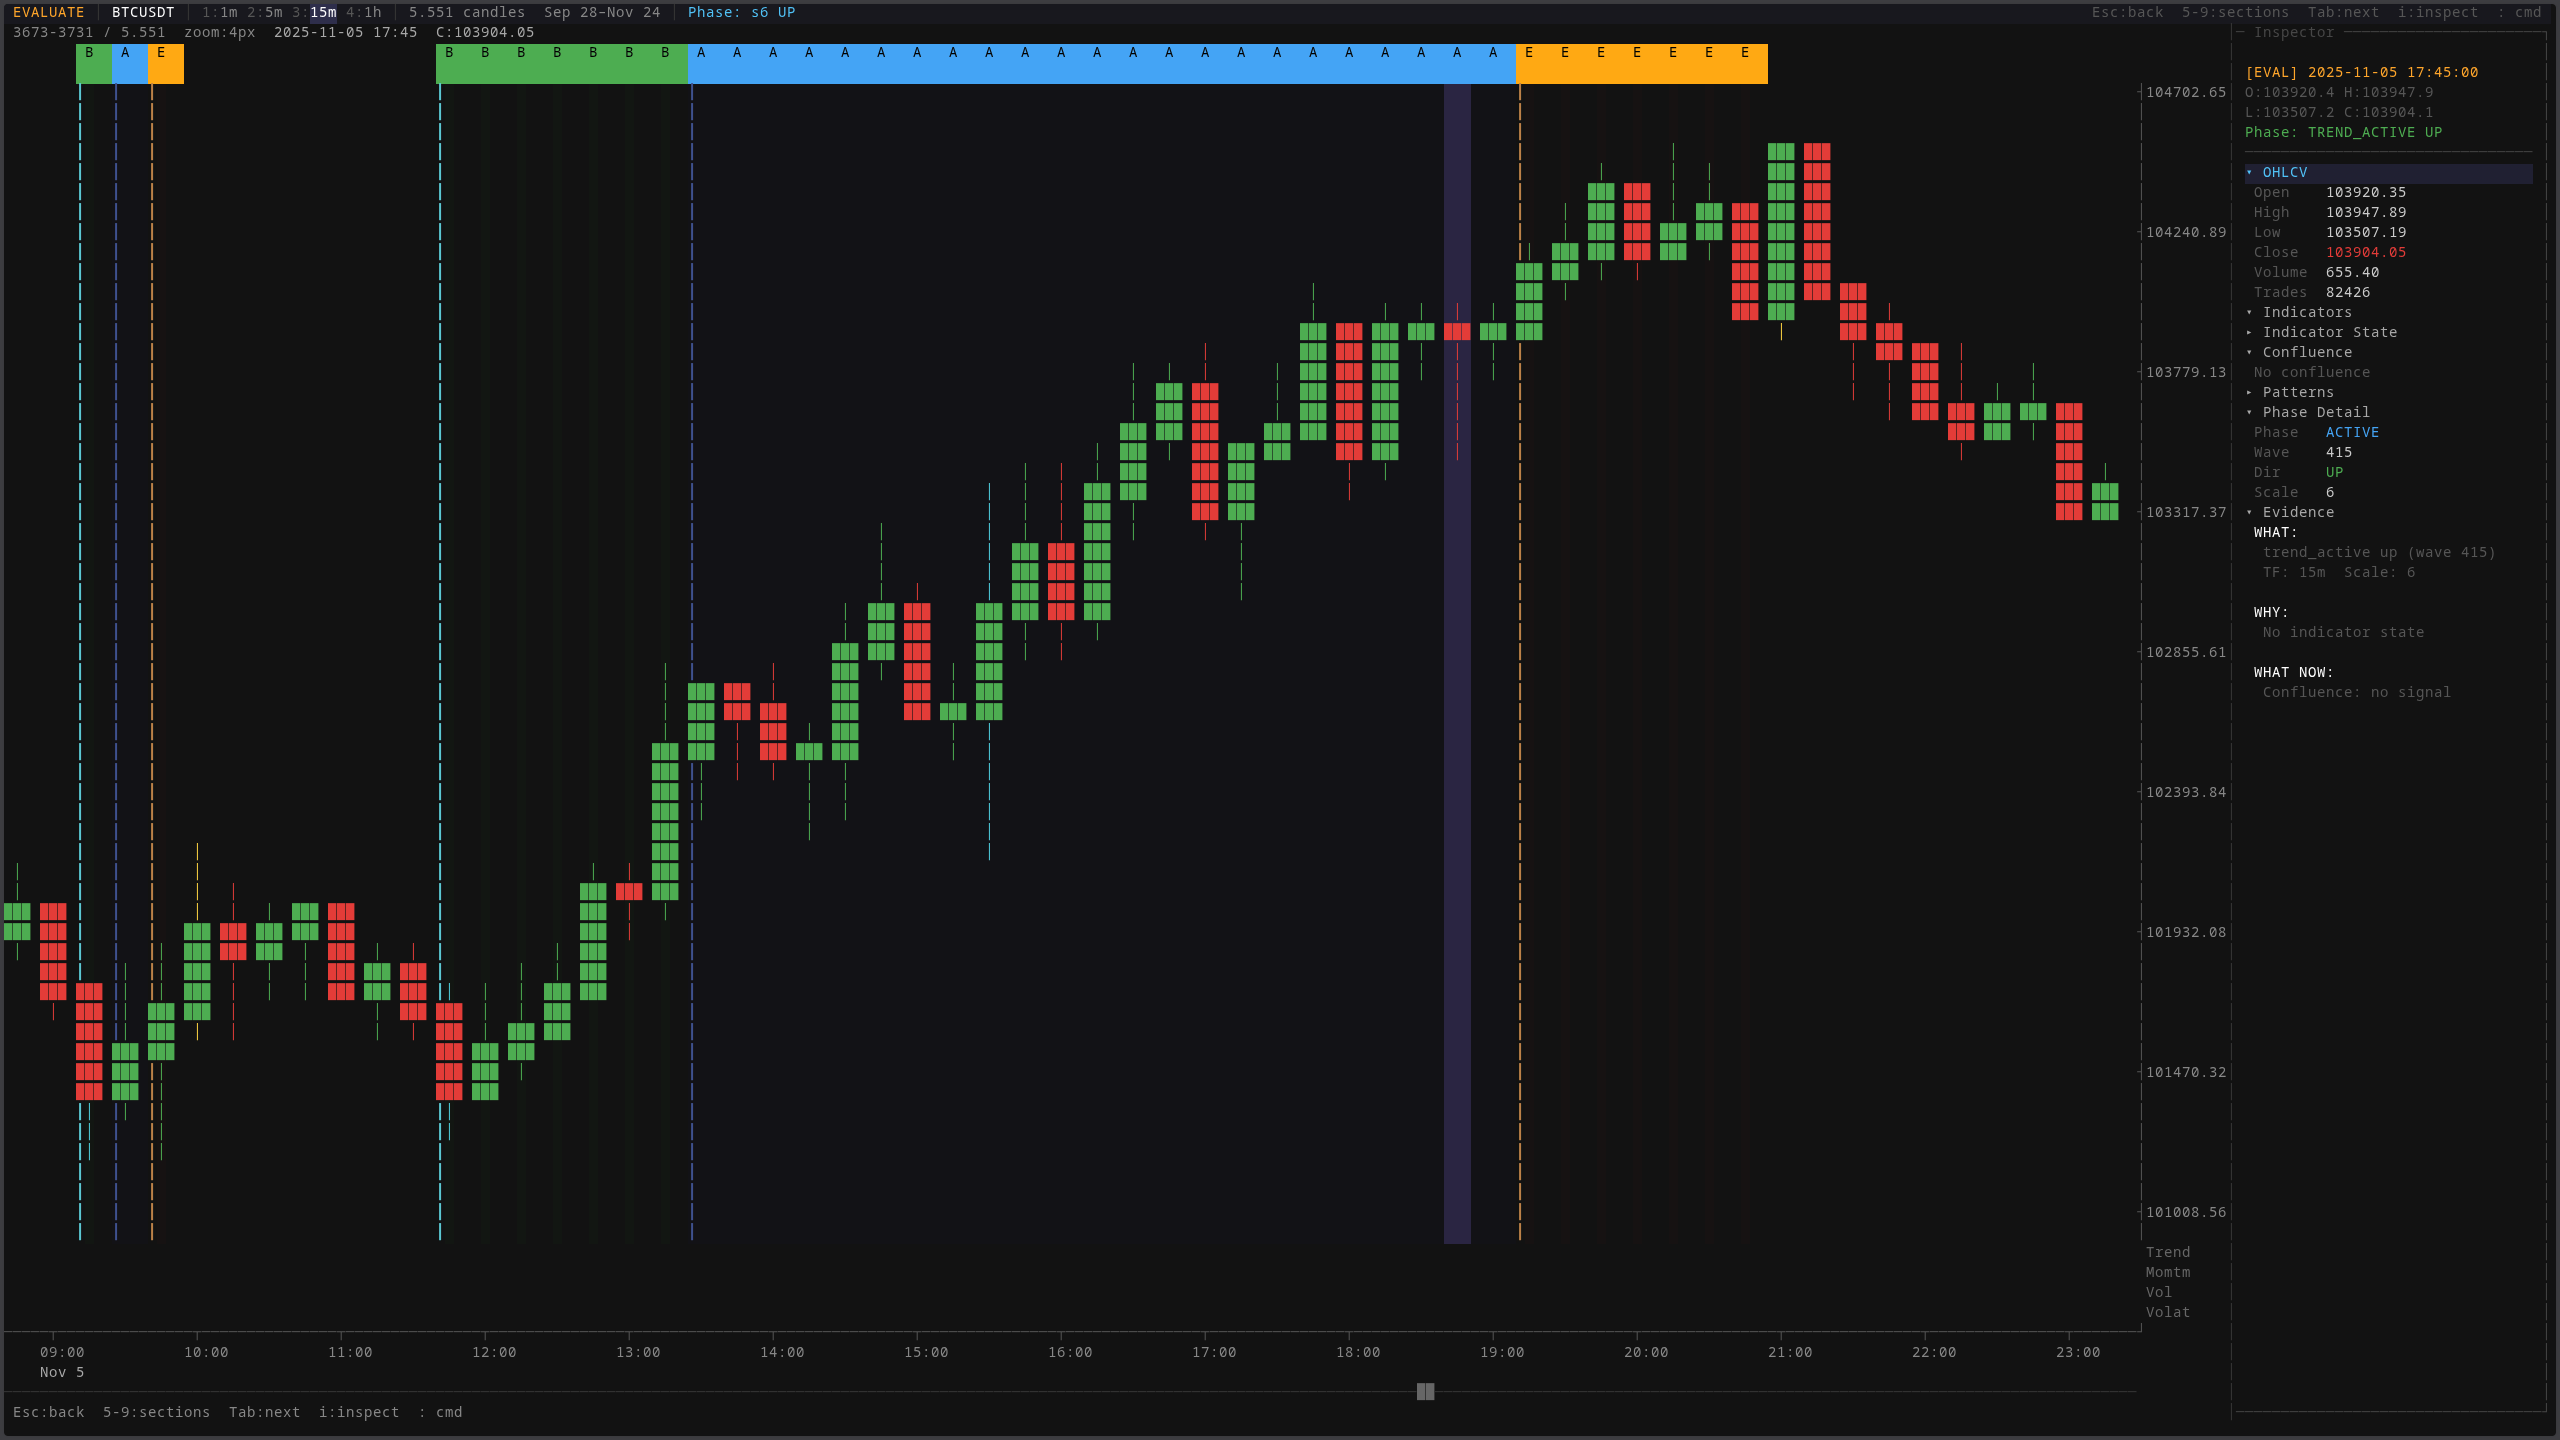
The evaluate mode labels every candle with its detected market phase (Begin, Active, or End of a trend) and the evidence panel explains why the system classified it that way. Not just a label, but the reasoning chain: what happened, what the indicators said, and what should happen next.
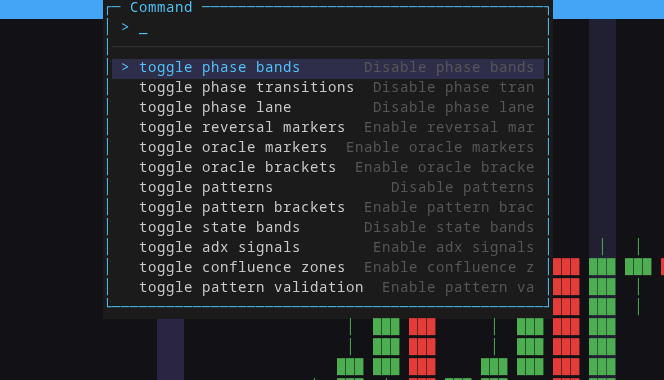
Everything is keyboard-driven. The command palette toggles any overlay on or off: phase bands, phase transitions, reversal markers, oracle brackets, patterns, state bands, ADX signals, confluence zones. Each overlay is a different lens on the same data. Stack them to see how multiple analysis dimensions interact.
Pattern validation markers show where the system detected candlestick patterns, what bias they suggest, and how confidently. The inspector panel on the right shows the full evidence chain for the selected candle, from raw OHLCV data all the way to the confluence score.
The dashboard connects to a FastAPI backend that serves data from the Parquet and SQLite stores. Multiple display modes, multiple scene types, settings persistence.
What I Learned
Building a trading system taught me more about software engineering than any other project. Not because the code is complex (the backtest engine is a few hundred lines) but because the consequences of being wrong are immediate and measurable. A bug in a web app shows a broken layout. A bug in a backtester shows a profitable strategy that doesn’t exist.
The deeper lesson is about intellectual honesty. Every version felt like the right approach at the time. Every version was wrong about something fundamental. The skill isn’t avoiding mistakes. It’s building systems that surface mistakes as quickly and cheaply as possible, before they matter.
Building for AI: the architecture that made everything work
The single most impactful decision in Synergy wasn’t a trading insight. It was an architectural one. I built the entire system to be readable and navigable by both humans and AI agents. This is the pattern I now use in every project.
Every layer has a README that explains its purpose, its boundaries, and its rules. The core layer holds all contracts, protocols, domain models, and domain errors. It has zero external dependencies. Standard library only. It shouldn’t be touched unless there’s a clear, documented reason. Because Claude Code understands this boundary, it almost never modifies core types. The result: code works on the first run, consistently.
The docs layer tracks everything versioned. Fourteen version documents, each with its own steps and decisions log. A global roadmap shows where the project has been and where it’s going. Every decision that gets made (technical, strategic, or architectural) gets an entry in decisions.md with the reasoning behind it. Every version gets a code quality audit and a check against the project’s vision.
Index files are the navigation system. Each layer has an index that lists every file, every function signature, all dependencies, and all policies (rules that must not be violated). When Claude needs to find code, it doesn’t grep the entire codebase. It reads the index. When it changes something, the index tells it what else might break and what constraints apply.
Because indexes can get large, a router sits on top: “if you’re working in this domain, look at these specific files.” This keeps context small and focused. The AI doesn’t need to load the entire system into memory to make a targeted change.
Usage instructions live in each layer’s index. Before computing metrics, go here. When running backtests, call this. When building strategies, start there. These instructions mean Claude doesn’t just know what the code does. It knows how the code is meant to be used. If it changes one component, it knows which other components depend on it and how to avoid breaking them.
The infra layer is purely about communication: how Synergy talks to the outside world (exchange APIs) and how components talk to each other. The app layer is pure orchestration: it decides what to run, when, and with which components. Entrypoints wire everything together.
This architecture isn’t just clean code practice. It’s what makes it possible to build a system of this complexity with an AI collaborator. The AI never gets lost, never violates boundaries it shouldn’t, and never makes changes that cascade into breakage. The architecture tells it, explicitly, what’s safe to touch and what isn’t.
Eight versions, fourteen documented iterations, thousands of experiment runs. The codebase is still clean, navigable, and extensible. That’s the real engineering achievement.
Where It Stands
Synergy is a fully operational research platform with thousands of experiment runs, a validated strategy in live paper trading, and a structured pipeline for continued research. The gap between “research” and “live trading” is one module: order execution.
The real deliverable was never the strategy. It’s the engine, the methodology, and the discipline of proving things before believing them.